You’ll typically pay about $2,315 a month for rent in Chelmsford, MA, with one‑bedrooms averaging the townwide rate, two‑bedrooms around $2,270 and three‑bedrooms over $3,400; South Chelmsford averages $2,408 for ~695 sq ft and the market shows about 419 available units. Expect utilities and groceries to push your cost of living higher (overall index ~119), and plan using a 30% rent‑of‑income rule — keep going to see neighborhood, budget, and buying vs. renting details.
What Is the Current Average Rent in Chelmsford, MA?

Curious what rent will cost you in Chelmsford right now? You’ll find the average rent in Chelmsford, Massachusetts is $2,315 per month as of October 2025. If you’re specifically hunting a two-bedroom, plan on about $2,270 monthly.
Curious about Chelmsford rent? Expect an average of $2,315 monthly — two-bedrooms around $2,270.
South Chelmsford is the most affordable neighborhood by availability, offering an average listed rent of $2,408 for units averaging 695 square feet, and it also has the most rentals overall—419 apartments currently on the market.
These figures give you a practical baseline for budgeting: use $2,315 as the town-wide mean, $2,270 for two-bedrooms, and expect smaller, denser units in South Chelmsford around $2,408. That difference helps you prioritize space versus cost when you compare listings.
Keep these specific numbers handy when calculating monthly housing expenses and evaluating whether Chelmsford, Massachusetts fits your rental budget.
Rent Trends: Year‑Over‑Year Changes and Quarterly Updates

How have rents in Chelmsford shifted recently? You’re seeing a modest year-over-year increase of 1.6%, about $38 more per month, bringing the October 2025 average to $2,315. That number gives you a quick sense of market direction without overreacting to short-term noise.
The latest quarterly update (September 2025) confirms rents rose versus the prior quarter, so momentum is upward. Two-bedroom units average roughly $2,270, and the town lists 419 available apartments—data you can use to gauge supply pressure. South Chelmsford shows an unusual pattern: it’s reported both as the most affordable and the most expensive area in the same set, with an average around $2,408 for a 695 sq ft unit and the highest inventory. That suggests local variation; neighborhood-level differences matter more than town-wide averages when you’re assessing deals or planning moves. Monitor quarterly updates for short-term shifts and year-over-year figures for trend confirmation.
Typical Rents by Unit Size (Studio to Three‑Bedroom)

Having seen rents inch up 1.6% year‑over‑year and inventory concentrated in South Chelmsford, it helps to look at typical rents by unit size to understand what that growth means for different household types. You’ll find clear stepping stones as unit size increases: studios start lower, one‑beds match the average, two‑beds rise for roommates or small families, and three‑beds command a premium.
- Studio — $1,811/month: compact, lower rent for single occupants; good if you prioritize location over space.
- One‑bedroom — $2,315/month: equals Chelmsford’s average rent; fits most singles or couples wanting separate living/sleeping areas.
- Two‑bedroom — ~$2,270–$2,723/month: market listings cluster here; cost depends on unit condition and exact size.
- Three‑bedroom — $3,439+/month: designed for families; expect a sizable jump in monthly housing cost.
Use these figures to compare budget scenarios by unit size and to evaluate tradeoffs between space and monthly rent.
Most Affordable Neighborhoods to Rent in Chelmsford

Where can you stretch your housing dollar in Chelmsford? South Chelmsford is the clear answer: it’s the most affordable neighborhood, with average rent at $2,408 per month and typical units around 695 sq ft. That smaller typical unit size helps keep monthly costs lower compared with other parts of town.
You’ll also find the largest share of rental inventory here — South Chelmsford hosts the most listings out of Chelmsford’s 419 available apartments for rent — so you get both choice and competitive pricing. Use the 30% affordability guideline: to comfortably afford that $2,408 rent, aim for a monthly income of about $8,027, or roughly $96,320 annually. If your budget is tighter, prioritize smaller units or shared rentals within South Chelmsford to reduce per-person cost. Overall, when you’re comparing neighborhoods, treat South Chelmsford as the benchmark for affordability and rental availability in Chelmsford.
Neighborhoods With the Highest Rents and Rental Inventory
Look at South Chelmsford first: it’s the priciest neighborhood with average rent at $2,408/month and average apartment size of 695 sq ft. You’ll also find the largest share of rental inventory there—South Chelmsford leads the city’s 419 available apartments. Compare those figures to the citywide two-bedroom average of $2,270/month to assess how much of your budget that neighborhood would consume.
Highest-rent Neighborhoods
Curious which Chelmsford neighborhoods cost the most? You’ll see South Chelmsford leads on both rent and volume: average rent $2,408/month for a 695 sq ft unit, above the statewide two-bedroom benchmark of $2,270. That premium reflects strong demand and concentration of listings.
- South Chelmsford — highest average rent ($2,408) and largest share of listings.
- Citywide context — typical two-bedroom rents average ~$2,270, showing South Chelmsford’s premium.
- Market signal — high rents plus many listings suggest active turnover and investor interest.
- Practical tip — if you’re budgeting, plan for a premium in South Chelmsford or consider nearby neighborhoods for lower rents.
Data-driven choices will help you balance price, size, and availability.
Rental Inventory Concentration
Having identified South Chelmsford as both the priciest and most listed neighborhood, it’s helpful to examine how rental inventory concentrates across the city and what that means for your search.
Chelmsford lists 419 available apartments, with South Chelmsford accounting for the largest share. There the average rent is $2,408 for a typical 695 sq ft unit, marking it the highest-cost pocket. That concentration pushes overall rental prices upward and reduces options if you’re targeting lower housing costs.
Use rental inventory data to prioritize neighborhoods with more listings or lower averages. For affordability guidance, model rent at 30% of income — South Chelmsford becomes a useful upper-bound case when you calculate what income level you’d need to afford local rents.
How Much Salary Do You Need to Live Comfortably in Chelmsford?
How much do you need to earn to live comfortably in Chelmsford? You’ll want to match local costs to realistic income needed targets, since Chelmsford’s cost of living is about 36% above the national average.
- Single person: $75,200/year (~$6,267/month) — this aligns with a balanced budget and modest savings.
- Family (typical household): $106,200/year (~$8,850/month) — covers higher childcare, utilities, and living expenses.
- Rent-focused guideline: two-bedroom rent averages $2,270/month — keep rent near 30% of income to stay on target.
- Practical rule: aim for pre-tax income that lets housing stay ≤30% and leaves room for essentials and savings.
These figures are data-driven benchmarks for planning. Use them to compare job offers or adjust your budget; if you can’t meet these incomes, expect compromises on housing size, commuting, or discretionary spending.
Cost of Living Breakdown: Housing, Utilities, Groceries, and Transport
To plan your monthly budget in Chelmsford, start with housing: typical two-bedroom rent runs about $2,270 and one-bedrooms average $2,315, while median gross rent is $1,887 and median housing costs for all households are $2,256.
Expect utilities to be above average (utilities index 115.9), and factor in groceries and transport within a local cost-of-living index of 144.7 (about 44.7% above the U.S. average).
With 83.2% owner-occupancy and 16.8% renters across 13,496 households, your specific costs will depend on whether you rent or buy and your commuting needs.
Housing and Rent Costs
Curious what you’ll pay to live in Chelmsford? You’ll find Rent and Housing costs above national norms, so plan accordingly. Data shows a typical two-bedroom rent of $2,270 per month, with a median gross rent of $1,887 and a median monthly housing cost of $2,256 for all households. South Chelmsford both leads listings and averages about $2,408 monthly for a 695 sq ft unit.
- Typical two-bedroom rent: $2,270/month.
- Median gross rent (all renters): $1,887/month.
- Median housing cost (all households): $2,256/month.
- Availability: 419 apartments listed; South Chelmsford has the most listings.
Renting a two-bedroom is 58.7% above the U.S. average and 5.7% above Massachusetts.
Utilities and Bills
Wondering what your monthly bills will look like in Chelmsford? Utilities in Chelmsford run above the national average: the utilities index is 115.9 and the overall cost of living sits at 119.1, so expect higher-than-typical energy and water charges. ERI’s housing data folds utility assumptions into standard lease cost estimates, meaning advertised rents—such as two-bedroom averages near $2,270—often reflect typical utility burdens used for budgeting. For planning, use the per-person and per-family utility estimates in the cost of living breakdown to project monthly bills alongside rent. In short, factor elevated utility costs into your housing decision: they materially increase total monthly outlay in Chelmsford and should be included when comparing neighborhoods or housing types.
Groceries and Transport
How much will your weekly food and commute add to the bill in Chelmsford? You’ll find groceries priced modestly—milk about $1.02/L, bread $3.05 per 0.5 kg—but overall costs are elevated by high rent and utilities, putting the city 36% above the national average. Expect transport and grocery spending to reflect that premium.
- Weekly groceries: budget around local prices, adjust for household size and preferences.
- Monthly transit: a pass is about $64.40; single tickets near $2.04, factor daily commutes.
- Rent interaction: two-bedroom rent (~$2,270/mo) raises discretionary cost room for groceries.
- Utilities impact: per-person $120 or family ~$188 shifts available spending on groceries/transportation.
Use these figures to plan a realistic monthly budget.
Housing Market Snapshot: Buying vs. Renting in Chelmsford
Want to rent or buy in Chelmsford? You’ll see rent, housing costs, and affordability trade-offs clearly in the numbers. Typical rents (Oct 2025) are $2,315 for a one-bedroom and $2,270 for a two-bedroom; three-bedrooms often exceed $3,439. Rents rose about 1.6% year-over-year, roughly $38 more monthly, and there are 419 apartments currently available, so selection exists but prices remain elevated.
Compare that to buying: the typical home costs $553,900, which — given current mortgage rates, taxes, and fees — can make monthly ownership costs competitive with or lower than renting for some households. Chelmsford’s housing cost index and overall cost of living sit about 44.7% above the U.S. average, so affordability is tighter than elsewhere. South Chelmsford shows wide rent variation, acting as both the most affordable and most expensive pocket. Use local inventory, your timeline, and upfront cash to decide whether renting or buying fits you best.
Demographics and Household Income That Shape Local Costs
You’ll want to factor in Chelmsford’s population profile — 36,220 residents with a median age of 42 and a near-even gender split — because age cohorts influence housing demand and service needs. With an average household size of 2.0, 72.9% family households, high owner-occupancy (83.2%), and renters paying a median gross rent of $1,887, housing cost pressures differ across household types. Also consider income and work patterns: average household income is $163,173 (median $138,810) and commuting/employment trends will shape spending on transport, childcare, and local services.
Population Age Breakdown
Curious what age and income patterns mean for living costs in Chelmsford? You’ll see population demographics that directly affect housing demand, services, and spending. With a total population of 36,220 and a median age of 42, the town skews toward mature households with stable incomes.
- 17.3% are under 15 — families drive demand for schools, kid services, and larger homes.
- 11.3% are 15–24 — fewer students/young renters means less pressure on low-cost rental stock.
- 24.1% are 25–44 — prime earning years; age distribution here supports strong local consumption.
- 28.9% are 45–64 and 18.4% 65+ — higher homeownership (83.2%) and median income levels stabilize prices.
Data-driven insights: median income and age mix suggest durable demand for owner-occupied housing and mid-to-high-end services.
Household Income Levels
How does household income shape living costs in Chelmsford? You’ll see higher local prices because Chelmsford’s median household income is $138,810 and the average income is $163,173 (2023 ACS). Those figures rose 4.2% and 6.4% year-over-year, respectively, signaling growing purchasing power that supports stronger demand for housing and services.
With 13,496 households—72.9% family households and 83.2% owner-occupied—market expectations skew toward larger, higher-quality housing, pushing two-bedroom rents near $2,270–$2,315.
Per-capita earnings and a predominantly white-collar workforce correlate with a cost of living notably above national averages. For budgeting, factor in higher housing, utilities, and local service prices relative to incomes; your household type and ownership status will materially affect monthly expense estimates.
Employment and Commuting Patterns
What fuels Chelmsford’s higher living costs? You’ll find the answer in employment and commuting dynamics that drive demand and prices. The town’s high median household income ($138,810) and average income ($163,173) reflect strong white-collar employment and support higher local prices.
- Workforce composition: 16,922 white-collar vs. 2,375 blue-collar workers, boosting wage-driven spending.
- Commuting mode: 96.8% drive private vehicles, raising household transport costs and shaping suburb-oriented services.
- Labor metrics: 3.7% unemployment, indicating stable employment that sustains housing demand and consumer spending.
- Housing tenure and demographics: 83.2% owner-occupied across 13,496 households, median age 42, higher education (30.2% bachelors) — all concentrate purchasing power and raise cost of living.
Practical Rent Affordability Tips and Budgeting Guidance

Want to know whether Chelmsford rent fits your budget? Start with rent affordability: the average two-bedroom runs about $2,315/month (broader two-bedroom cited at $2,270), and South Chelmsford averages $2,408 for a 695 sq ft unit. Since housing drives a cost of living roughly 44.7% above the US average (housing index ~188.4), factor higher baseline expenses into every plan.
For budgeting, cap rent at 30% of take-home pay. That means aiming for roughly $6,267/month income for a single renter at $2,315 rent, or about $8,850/month for family-level costs when rents hit $2,408. Use those targets to screen listings from the 419 available apartments and prioritize neighborhoods with better value.
Practical steps: build a monthly spreadsheet, include higher local utilities and transport, save a 3–6 month emergency fund, and reassess after six months to adjust allocations based on actual spending and rental market activity.
Frequently Asked Questions
What Is the Average Cost of Living in Chelmsford?
You’ll face a high cost of living in Chelmsford: housing affordability is tight with median rent around $1,887–$2,270, income needs show cost comparison to Boston, and healthcare access remains good but adds expenses.
Is It Expensive to Live in Chelmsford, MA?
Like a hot stove, yes — you’ll face high heat from rising rents, long commutes, and steep expenses; you’ll need roughly $75K–$106K annually, with one-bedroom rent near $2,315 and two-bedroom about $2,270.
Is Chelmsford Expensive to Rent?
Yes — you’ll find Chelmsford has expensive rent compared to national averages; cost comparison shows housing affordability is strained, with typical two‑bedroom and median rents pushing many households toward higher income requirements.
What Is the Average Income in Chelmsford MA?
The average income in Chelmsford is about $163,173 per household annually; you’ll use that to gauge chelmsford costs and rent affordability, noting rising incomes improve affordability but rents may still strain some households.
Conclusion
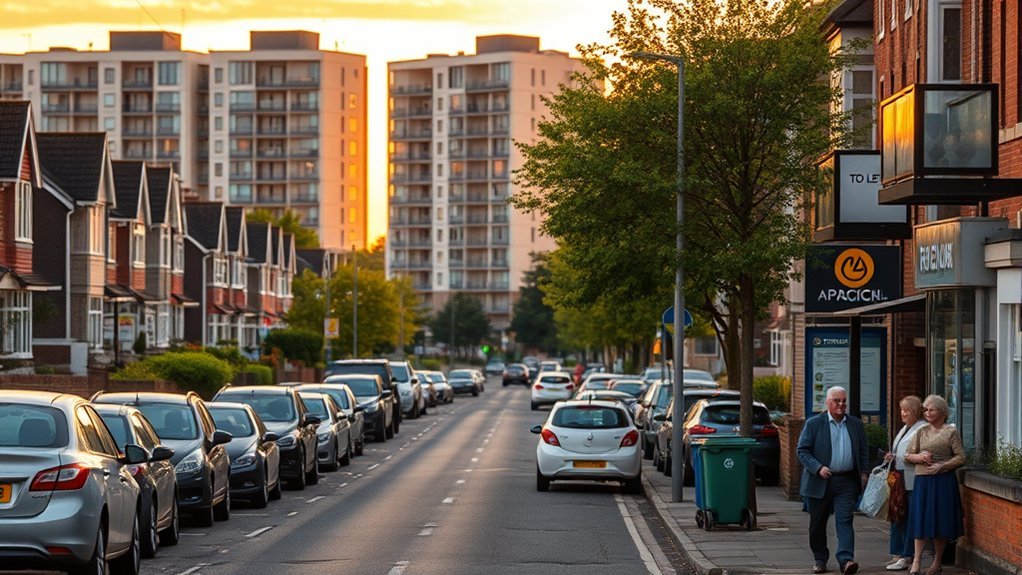
You’re walking down a Chelmsford street lined with red-brick homes and maple trees, comparing rent ads in your head — that snapshot tells the story: rents vary by unit size and neighborhood, utilities and groceries add a steady drip to monthly costs, and buying often needs a bigger upfront leap than renting. Use local rent trends and income benchmarks to map a budget, prioritize essentials, and target affordable neighborhoods to keep your monthly finances steady and predictable.


