

Last updated: July 28, 2026. The cost of living in Chelmsford, Massachusetts is driven mainly by housing. Current asking-rent estimates vary because rental websites track different property types and samples, but a practical starting range is about $2,300 to $2,800 per month before utilities. Households should also budget for transportation, food, medical costs, internet, move-in deposits, and winter heating.
Quick Answer
Current Chelmsford asking-rent estimates vary by source. In July 2026, Apartments.com reported $2,334 for its typical apartment, while Zillow reported $2,752 across all bedroom counts and property types. A renter should generally budget about $2,300–$2,800 monthly before utilities, then verify the exact unit’s fees and included services.
Key Takeaways
- July 2026 asking-rent estimates range from roughly $2,334 to $2,752, depending on the property types and listings included.
- Apartments.com lists typical rents near $1,946 for a studio, $2,334 for one bedroom, $2,798 for two bedrooms, and $3,523 for three bedrooms.
- At the 30% affordability benchmark, a $2,334 rent requires about $93,360 in gross annual income.
- The Census Bureau’s $2,062 median gross rent is a 2020–2024 historical measure and should not be confused with current asking rent.
- Massachusetts landlords may collect first month’s rent, last month’s rent, a security deposit of up to one month, and reasonable lock-and-key costs.
Note: “Average rent” is not one standardized number. Apartment platforms may count only managed apartment communities, all advertised homes, individual listings, or available floorplans. Always check the source date and coverage before comparing figures.
What Is the Current Average Rent in Chelmsford, MA?
Current asking rents in Chelmsford generally fall in the mid-$2,000s, but the exact figure depends on the rental dataset. The following estimates were the most recent available during this July 2026 review:
| Source and date | Reported rent | What it measures |
| Apartments.com, July 1, 2026 | $2,334/month | Its typical Chelmsford apartment, with an average size near 695 square feet |
| RentCafe, June 2, 2026 | $2,649/month | Apartment properties covered by Yardi Matrix, mainly buildings with 50 or more units |
| Zillow, July 5, 2026 | $2,752/month | All bedroom counts and advertised property types in its rental dataset |
| U.S. Census Bureau, 2020–2024 | $2,062 median gross rent | Historical rent paid by existing renters, including contract rent and applicable utility costs |
For planning a new lease, the current asking-rent sources are more useful than the Census median. The Census figure remains valuable for understanding what established renter households paid over the 2020–2024 survey period, but it does not represent today’s advertised price for a newly available apartment.
A realistic July 2026 starting budget for a newly advertised Chelmsford rental is approximately $2,300–$2,800 per month before separately billed utilities, parking, pets, or other fees.
Chelmsford Rent Trends and Recent Changes
Recent rent movement looks relatively flat, but platforms disagree on whether rents rose or fell slightly. Apartments.com reported a 0.2% year-over-year increase in July 2026. RentCafe reported a 0.42% decrease as of June 2026, while Zillow reported an increase of $27 across its broader all-property dataset.
These differences do not necessarily mean one source is wrong. Each platform may include different buildings, property types, active listings, lease terms, and bedroom mixes. A few newly listed luxury apartments can also change a small local sample.
- Apartments.com: Up about 0.2% year over year.
- RentCafe: Down about 0.42% year over year.
- Zillow: Up $27 year over year in its July 2026 rental summary.
Pro Tip: Track the same bedroom count and property type on the same platform for several weeks. Comparing an apartment-only index one month with an all-property index the next can create a false impression of a sharp market change.
Typical Chelmsford Rent by Apartment Size
The following July 2026 apartment figures use one consistent source, Apartments.com, so the bedroom categories can be compared without mixing methodologies:
| Apartment size | Average monthly rent | Average size |
| Studio | $1,946 | 322 sq. ft. |
| One bedroom | $2,334 | 695 sq. ft. |
| Two bedrooms | $2,798 | 967 sq. ft. |
| Three bedrooms | $3,523 | 1,346 sq. ft. |
Actual listings may fall above or below these figures based on age, condition, location, lease length, air conditioning, parking, laundry, pet policies, and whether heat or hot water is included. A lower advertised rent may not be the less expensive choice after mandatory fees and utilities are added.
Where to Look for Lower-Cost Rentals in Chelmsford
Current platform data does not support declaring one Chelmsford neighborhood the town’s definitive cheapest area. Apartments.com identifies South Chelmsford as the most affordable neighborhood, but South Chelmsford is also the only neighborhood displayed in that platform’s affordability comparison.
Its current South Chelmsford estimate is approximately $2,547 per month for an average unit of about 740 square feet. Because there is no second neighborhood in the comparison, that number should be treated as a local listing benchmark rather than proof that South Chelmsford always has the lowest rent.
To find better value, compare individual listings using:
- Total monthly rent and mandatory recurring fees
- Rent per square foot
- Heating type and whether heat or hot water is included
- Parking charges and the number of included spaces
- Laundry access and appliance condition
- Commute time to work, school, or transit
- Lease length, renewal terms, and move-in incentives
Older properties, smaller units, shared rentals, and homes farther from major commercial corridors may offer lower base rent. However, longer driving distances or high heating costs can erase part of the savings.
How to Read South Chelmsford Rent and Inventory Data
Some rental pages label South Chelmsford as the cheapest, most expensive, and most available neighborhood at the same time. This happens because the platform currently displays only one Chelmsford neighborhood-level category. It is a data-coverage limitation, not evidence that South Chelmsford occupies every market position.
Why Rental Listing Counts Differ
Rental inventory totals also depend on what a website counts. During this review, Apartments.com displayed 445 available apartments, while Zillow displayed 39 available rentals across its all-property dataset. The larger number may include multiple units, floorplans, or availability dates within the same apartment community.
Neither figure should be interpreted as an official count of all vacant homes in Chelmsford. Listing counts can include duplicate syndication, future availability, multiple floorplans at one address, and units that have not yet been removed after an application.
How to Compare Available Rentals
- Open the individual property page rather than relying only on the search-result count.
- Confirm the unit number, available date, rent term, and required fees.
- Ask whether the displayed rent applies to every lease length.
- Confirm whether a concession is already averaged into the advertised monthly price.
- Verify availability directly with the property manager before paying an application fee or deposit.
How Much Salary Do You Need to Live in Chelmsford?
The salary you need depends on household size, childcare, debt, transportation, savings goals, and the apartment you choose. Two benchmarks are useful: the 30% housing guideline and MIT’s itemized Middlesex County living-wage estimate.
Income Needed Under the 30% Rent Guideline
The 30% benchmark compares monthly housing cost with gross pretax income. It is a screening tool, not a guarantee that the remaining income will cover every household’s needs.
| Rent example | Gross monthly income at 30% | Gross annual income |
| $1,946 studio | $6,487 | $77,840 |
| $2,334 one bedroom | $7,780 | $93,360 |
| $2,547 South Chelmsford benchmark | $8,490 | $101,880 |
| $2,798 two bedrooms | $9,327 | $111,920 |
Middlesex County Living-Wage Benchmarks
The MIT Living Wage Calculator, updated February 15, 2026, estimates the pretax income required to meet basic needs in Middlesex County:
- One adult, no children: $70,707 per year
- One adult with one child: $131,941 per year
- Two adults, one working, two children: $114,125 per year
- Two adults, both working, two children: $176,193 in combined annual income
The two-working-adult family estimate is higher partly because it includes paid childcare. These figures represent basic-needs budgets, not luxury spending, large retirement contributions, substantial debt repayment, or a large emergency-fund goal.
Warning: A landlord’s income-screening requirement may be stricter than the 30% guideline. Some properties use their own income multiple, credit, guarantor, or deposit standards. Confirm the written qualification policy before paying a nonrefundable application charge.
Cost of Living Breakdown: Housing, Utilities, Food, and Transportation
There is no single official Chelmsford cost-of-living index. A more transparent approach is to combine current local rent with itemized Middlesex County expenses. MIT’s 2026 model estimates the following average monthly basic-needs costs:
| Expense | One adult, no children | Two working adults, two children |
| Housing | $2,367/month | $3,020/month |
| Food | $427/month | $1,248/month |
| Childcare | $0 | $3,578/month |
| Medical | $339/month | $994/month |
| Transportation | $668/month | $1,120/month |
| Internet and mobile | $173/month | $221/month |
| Civic and other needs | $681/month | $1,580/month |
| Required income after taxes | $4,654/month | $11,761/month |
These are Middlesex County estimates rather than a promise of what every Chelmsford household will spend. Your costs may be higher or lower based on housing choice, health coverage, commuting distance, childcare arrangements, food preferences, and debt.
Housing and Rent Costs
Housing is usually the largest monthly expense. Current asking-rent benchmarks start near $1,946 for a studio and rise above $3,500 for a typical three-bedroom apartment. The Census Bureau reports a 2020–2024 median gross rent of $2,062 and median monthly owner costs of $2,983 for homeowners with a mortgage.
Those Census figures describe existing households over a multi-year survey period. They should not be used as direct quotes for a new lease or new mortgage in July 2026.
When comparing rentals, calculate the full recurring housing cost:
- Base rent
- Electricity and heating fuel
- Water, sewer, or trash charges if billed separately
- Internet
- Parking
- Pet rent
- Renter’s insurance
- Required amenity or service fees
Utilities and Monthly Bills
Utility costs can vary sharply because Chelmsford homes use different heating systems, building ages, insulation levels, and utility arrangements. Massachusetts electric supply rates also change by utility, service period, and supply option. The state’s Department of Public Utilities rate page provides current basic-service information.
Before signing a lease, ask:
- Is heat included in rent?
- Is hot water included?
- Does the unit use gas, electricity, oil, propane, or a heat pump?
- Who pays water, sewer, and trash?
- Can the landlord or utility provide recent monthly usage or billing history?
- Are there separate common-area, billing, or service charges?
Pro Tip: Ask for 12 months of utility history rather than one summer bill. Winter heating can make a low-rent apartment more expensive over a full year.
Groceries and Transportation
MIT’s 2026 Middlesex County model budgets approximately $427 per month for one adult’s food and $1,248 for two adults with two children. The same model estimates transportation at about $668 for one adult and $1,120 for that four-person household.
Chelmsford is served by the Lowell Regional Transit Authority, including Routes 15, 16, and 17. As of July 2026, LRTA fixed routes are fare-free through September 30, 2026. Fares may resume on October 1, 2026 if additional funding is not approved, so check the LRTA news page before relying on a zero-fare budget.
Public transit can lower commuting costs for households near a useful route, but many residents still need a car for work, errands, school, or last-mile travel. The Census Bureau reports an average Chelmsford commute of about 28 minutes for workers age 16 and older during 2020–2024.
Housing Market Snapshot: Buying vs. Renting in Chelmsford
Buying requires substantially more upfront cash than renting. According to Zillow’s Chelmsford housing data, the typical home value was approximately $696,379 as of June 30, 2026.
The purchase price alone does not show whether buying is cheaper than renting. A proper comparison must include:
- Down payment and closing costs
- Mortgage principal and interest
- Property taxes
- Homeowners insurance
- Condominium or homeowners-association fees
- Maintenance and major repairs
- Expected length of ownership
- The return that the down payment could earn elsewhere
- Costs of selling and moving later
Renting generally offers lower upfront cost, less maintenance responsibility, and easier relocation. Buying offers more control over the property and potential long-term equity, but it also creates repair risk and ties up cash.
Note: The Census median monthly owner cost of $2,983 reflects existing homeowners with mortgages during 2020–2024. It is not an estimate of what a buyer financing a typical Chelmsford home would pay in 2026.
Demographics and Household Income That Shape Local Costs
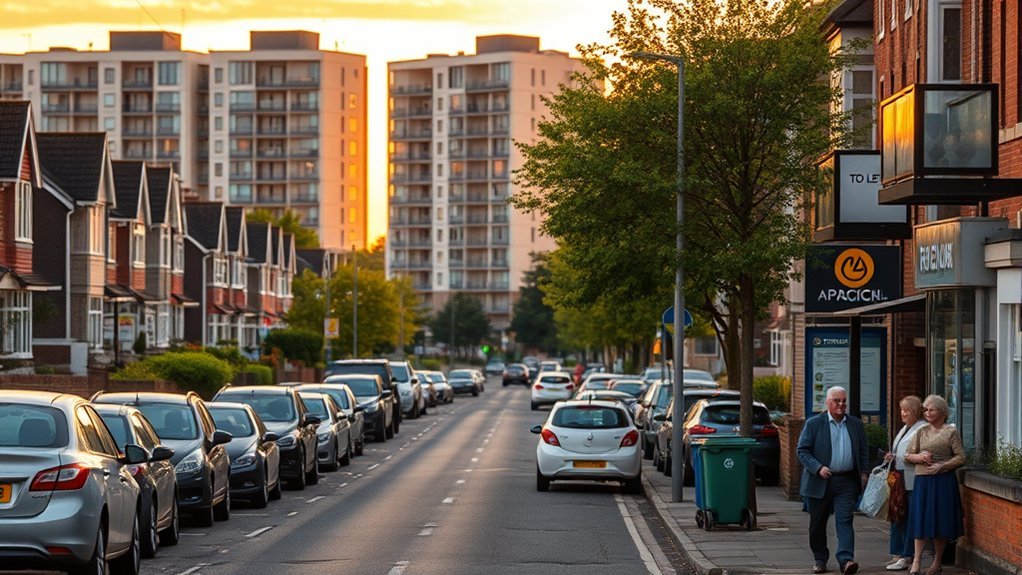
Chelmsford has a relatively high household income and homeownership rate, but that does not make every resident financially comfortable. Renters, first-time buyers, single-income households, and families paying for childcare may face much tighter budgets than townwide averages suggest.
Population and Housing Profile
The latest U.S. Census Bureau QuickFacts reports:
- Population estimate, July 1, 2025: 38,549
- Households, 2020–2024: 13,450
- Persons per household: 2.68
- Owner-occupied housing rate: 82.1%
- Residents under age 18: 21.6%
- Residents age 65 or older: 18.1%
- Median owner-occupied home value, 2020–2024: $593,700
- Median gross rent, 2020–2024: $2,062
The high ownership rate means Chelmsford has a smaller renter share than many urban markets. That can limit rental selection and make a few large apartment communities especially influential in commercial rent datasets.
Household Income Levels
The Census Bureau reports a median household income of $140,629 in 2024 inflation-adjusted dollars for 2020–2024. Per-capita income was $60,022, and approximately 4.7% of residents were below the poverty line.
Median household income is the midpoint across households; it is not the typical salary of one worker. It also combines households with different numbers of earners. Renters should compare housing costs with their own gross income, debt, savings, and household needs rather than assuming the townwide median applies to them.
Employment, Education, and Commuting
Census QuickFacts reports that 68.8% of residents age 16 and older participated in the civilian labor force during 2020–2024. About 52.8% of adults age 25 and older held at least a bachelor’s degree, and the mean travel time to work was 28 minutes.
Commute cost can vary widely. A household working remotely may spend less on fuel and vehicle wear, while a household with two long-distance drivers may spend substantially more than a countywide transportation estimate.
Practical Rent Affordability and Budgeting Guidance
Start with the full cost of the lease rather than the advertised rent alone. Build a monthly budget that includes rent, utilities, food, transportation, healthcare, debt payments, savings, and irregular expenses.
- Choose a rent ceiling: Use 30% of gross income as an initial screen, then lower the ceiling if childcare, debt, healthcare, or commuting costs are high.
- Add utilities: Estimate heat, electricity, water, internet, and renter’s insurance separately unless the lease clearly includes them.
- Check recurring fees: Add parking, pets, amenities, trash, package services, and required billing fees.
- Plan for move-in cash: A lease may require several months’ worth of rent upfront.
- Keep emergency savings: Aim to preserve enough cash for income interruptions, medical expenses, vehicle repairs, or an unexpected move.
- Compare annual cost: Multiply monthly recurring costs by 12 and include one-time charges before deciding which apartment is cheaper.
Upfront Move-In Costs in Massachusetts
According to Massachusetts housing guidance, a landlord may collect:
- First month’s rent
- Last month’s rent
- A security deposit no greater than one month’s rent
- The cost of purchasing and installing a lock and key
At a $2,334 monthly rent, first month, last month, and a full one-month security deposit would total $7,002, plus permitted lock-and-key costs. At $2,798 rent, the same three payments would total $8,394.
Warning: Never send a deposit solely because someone claims other renters are waiting. Confirm the property, landlord or licensed agent, lease terms, payment recipient, and refund rules. This summary is general budgeting information and not legal advice.
Example One-Bedroom Rental Budget
A renter considering a $2,334 one-bedroom could start with the following planning framework:
| Budget category | Planning amount |
| Rent | $2,334 |
| Food benchmark | About $427 |
| Transportation benchmark | About $668 |
| Medical benchmark | About $339 |
| Internet and mobile benchmark | About $173 |
| Utilities, insurance, debt, savings, and personal spending | Household-specific |
This example is not a complete guaranteed budget because utilities, taxes, health coverage, debt, and personal spending vary. It shows why a household may need more income than the basic 30%-of-rent calculation suggests.
Frequently Asked Questions
What is the average cost of living in Chelmsford?
There is no single official Chelmsford cost-of-living figure. Current rental estimates generally range from about $2,300 to $2,800 per month before utilities. MIT estimates that one adult in Middlesex County needs about $70,707 in annual pretax income to meet basic needs in 2026.
Is it expensive to live in Chelmsford, MA?
Chelmsford can be expensive, especially for new renters and homebuyers. Typical one-bedroom apartment rent is above $2,300 on Apartments.com, while Zillow’s June 2026 typical home value was about $696,379. Childcare, vehicle costs, and heating can raise the required household budget further.
What is the average rent in Chelmsford, MA?
The answer depends on the dataset. Apartments.com reported $2,334 for its typical apartment in July 2026, RentCafe reported $2,649 for its covered apartment properties, and Zillow reported $2,752 across all bedrooms and property types.
How much income do I need for a Chelmsford apartment?
Using the 30% gross-income guideline, a $2,334 monthly rent requires about $93,360 in annual pretax income. A $2,798 two-bedroom requires about $111,920. Utilities and other debts may justify choosing a lower rent ceiling.
What is the median household income in Chelmsford?
The U.S. Census Bureau reports a median household income of $140,629 in 2024 inflation-adjusted dollars for the 2020–2024 period. That is a household measure and may include more than one earner.
How much cash might I need to move into an apartment?
Massachusetts landlords may collect first month’s rent, last month’s rent, a security deposit of up to one month’s rent, and permitted lock-and-key costs. At $2,334 per month, the first three items could total $7,002.
Sources
- U.S. Census Bureau QuickFacts: Chelmsford — population, households, income, rent, homeownership, education, and commuting data.
- MIT Living Wage Calculator: Middlesex County — 2026 income requirements and itemized basic-needs expenses.
- Apartments.com Chelmsford Rent Market Trends — July 2026 apartment rent, bedroom, size, and listing data.
- Zillow Chelmsford Housing Market — June 2026 typical home value and housing-market measures.
- Mass.gov Security Deposits and Last Month’s Rent — permitted Massachusetts move-in payments and deposit handling.
- Lowell Regional Transit Authority News — current fare-free program and Chelmsford-area transit updates.
Conclusion
The cost of living in Chelmsford is shaped mainly by rent, childcare, transportation, and the cost of entering the local housing market. A new renter should generally plan for approximately $2,300–$2,800 per month in base rent, verify every utility and recurring fee, and prepare for several months of rent in upfront move-in costs.
Use current asking rents for apartment shopping, Census figures for historical community context, and an itemized household budget for the final decision. Comparing those measures separately produces a far more reliable answer than relying on one unsupported cost-of-living index or a single “average rent” number.
