
There is no single universal 2026 ranking of U.S. hotel cities because major datasets measure different properties, dates, locations, and rate types. In Engine’s multi-month hotel-price dataset covering 50 major U.S. markets from May 2024 through April 2026, New York ranks highest at $336 per night and Boston second at $311. In the narrower October 2025 Cheaphotels.org city-center survey, Boston ranks first at $375 and New York City second at $338.
Last updated: September 7, 2026. This update adds Engine’s multi-month 2026 market data, adds city-level seasonality, clarifies the June 2025 Booking.com snapshot, and rechecks CoStar and FTC guidance.
Methodology note: This is a source-based hotel-price comparison using published rate datasets and official regulatory guidance. It is not an individual-hotel review or a live booking quote.
Quick Answer
For a broad multi-month 2026 comparison, New York is the most expensive of the 50 U.S. markets in Engine’s dataset at $336 per night, followed by Boston at $311. A separate October 2025 city-center survey reverses the order: Boston was $375 and New York $338 for the cheapest available double room in a centrally located three-star-or-better hotel. Use the figures as comparison benchmarks, not guaranteed booking quotes.
Key Takeaways
- New York leads Engine’s current 50-market multi-month benchmark at $336 per night, with Boston second at $311.
- Boston led the October 2025 Cheaphotels.org city-center survey at $375, followed by New York at $338.
- A separate June 14–15, 2025 Booking.com snapshot produced much higher prices in Boston, New York, Orlando, Virginia Beach, and Chicago, showing why dates and methodology matter.
- CoStar reported a nationwide U.S. hotel average daily rate of $173.76 in June 2026, but that industry-wide ADR is not directly comparable with either city ranking.
- Compare the total stay price for your exact dates, including mandatory fees, government taxes, parking, transportation, and optional extras.
Which U.S. Cities Have the Most Expensive Hotels in 2026?
For the broadest current multi-month comparison used in this guide, Engine analyzed 128,536,941 public hotel-rate observations across 50 major U.S. markets from May 2024 through April 2026. The rates were the cheapest publicly available nightly rates shown when travelers searched, not negotiated corporate rates and not necessarily the final price ultimately booked.
New York ranked first at $336 per night, followed by Boston at $311. Washington, D.C., Chicago, and Palm Springs completed the top five. Because this dataset spans almost two years rather than one weekend or one month, it provides a useful 2026 market comparison, but it still should not be treated as a quote for your specific stay.
| Rank | U.S. Market | Multi-Month Average Nightly Rate |
|---|---|---|
| 1 | New York | $336 |
| 2 | Boston | $311 |
| 3 | Washington, D.C. | $252 |
| 4 | Chicago | $233 |
| 5 | Palm Springs | $229 |
| 6 | Philadelphia | $205 |
| 7 | Seattle | $204 |
| 8 | San Diego | $198 |
| 9 | Detroit | $193 |
| 10 | Miami | $191 |
How These Hotel Price Rankings Were Built
The article now uses two primary city-ranking datasets because each answers a different question. Engine’s 2026 hotel-price research provides a multi-month market view based on more than 128 million public rate observations across 50 U.S. markets from May 2024 through April 2026.
The second ranking uses the Cheaphotels.org Hotel Price Index published October 10, 2025. That survey recorded the average price of the cheapest available double room in a centrally located hotel rated at least three stars for stays from October 1 through October 31, 2025.
That Cheaphotels.org definition is narrower than a citywide average daily rate. It excludes many suburban, airport, budget, and luxury properties and reflects one month rather than an entire year. The 2025 survey covered a selected group of cities worldwide, so its ranking should be read as the most expensive among the U.S. cities included in that survey.
For a broader national hotel-tier benchmark, compare this methodology with the site’s 2026 U.S. 3-star hotel cost guide or mid-range U.S. hotel budget guide.
Note: There is no single official 2026 ranking of every U.S. city by hotel price. CoStar and Tourism Economics raised their 2026 U.S. hotel outlook in June 2026. CoStar later reported a nationwide June 2026 average daily rate of $173.76, up 6.7% from June 2025. That national ADR measures a broad hotel market and should not be substituted for either city-level ranking.
October 2025 City-Center Hotel Ranking for 2026 Planning
The table below provides a second consistent comparison using Cheaphotels.org’s October 2025 methodology. It measures the cheapest qualifying central double room rather than the multi-month public-rate averages in the Engine table above. Because Los Angeles, Atlanta, and Philadelphia were tied at $158, the table contains 11 cities while the final three share rank 9.
| Rank | U.S. City | October 2025 Benchmark Per Night |
|---|---|---|
| 1 | Boston | $375 |
| 2 | New York City | $338 |
| 3 | Detroit | $240 |
| 4 | Washington, D.C. | $227 |
| 5 | Austin | $184 |
| 6 | Chicago | $176 |
| 7 | San Diego | $175 |
| 8 | Seattle | $164 |
| 9 | Los Angeles | $158 |
| 9 | Atlanta | $158 |
| 9 | Philadelphia | $158 |
Four Hotel Price Metrics You Should Not Mix
Hotel-price rankings can look contradictory when they measure different dates, locations, room inventories, or market segments. These four benchmarks answer different questions:
| Benchmark | What It Measures | Best Use |
|---|---|---|
| Engine May 2024–April 2026 dataset | Multi-month averages from more than 128 million public-rate observations across 50 U.S. markets. | Broad city-to-city comparison and seasonality. |
| October 2025 city survey | Average price of the cheapest available double room in a central three-star-or-better hotel over October 1–31. | Comparing selected cities with one consistent city-center methodology. |
| June 14–15, 2025 Booking.com snapshot | A one-night Saturday-to-Sunday price sample for three-star-or-better hotels near city centers, reported from Gourmet Marketing research summarized by Mental Floss. | Showing how expensive one particular weekend could appear. |
| June 2026 U.S. ADR | CoStar’s broad nationwide average daily rate of $173.76 across occupied hotel rooms in its measured market. | Tracking national hotel-industry performance, not ranking individual cities. |
Practical rule: Use Engine when you want a broad multi-month market comparison, Cheaphotels.org when you want a like-for-like October city-center comparison, the Booking.com snapshot only for that sampled June 2025 weekend, and CoStar ADR when you want national hotel-industry performance.
Boston: No. 1 in the October City-Center Survey

Boston ranked first at $375 per night in the October 2025 Cheaphotels.org survey. That was the average price of the cheapest qualifying double room, not the average price of every Boston hotel and not a luxury-hotel average.
Engine’s broader multi-month dataset places Boston second at $311 per night and lists October as its priciest month. The two findings fit together: October can make Boston look especially expensive compared with a multi-month average.
Under the similar October 2024 Cheaphotels.org survey, Boston was $320. The move from $320 to $375 is an increase of about 17%. Because both surveys focus on October and central hotels, that change should not be described as a full-year increase across every Boston hotel.
Boston remains appealing because central hotels can place travelers near the Freedom Trail, the Boston Tea Party Ships & Museum, other historic areas, universities, museums, and business districts. That convenience can become especially expensive when high seasonal demand overlaps with limited central inventory.
A city ranking is only useful when every rate is measured with the same dates, location rules, hotel inventory, and rate definition.
New York City: No. 1 in the Multi-Month Benchmark
New York ranks first at $336 per night in Engine’s multi-month 50-market dataset. It ranked second at $338 in the separate October 2025 Cheaphotels.org city-center benchmark.
New York has a very wide price range. A limited-service property outside Midtown may cost far less than a luxury hotel near Times Square, Central Park, or Fifth Avenue. Travelers visiting the Statue of Liberty or other attractions may also pay more for convenient transit access. Borough, neighborhood, room size, cancellation terms, and major events can change the total by hundreds of dollars.
For a fair comparison, search the same dates and use the map to compare hotels in equivalent neighborhoods rather than comparing a Manhattan hotel with a property far from the attractions you plan to visit.
Orlando: Why Some Rankings Show a Much Higher Price
Orlando illustrates the danger of mixing data sets. A separate Booking.com price snapshot summarized by Mental Floss reported an average of $401.14 for a Saturday-to-Sunday stay from June 14 to June 15, 2025. The analysis focused on three-star-or-better hotels within roughly three kilometers of the city center. In the month-long October 2025 city-center survey used for the second ranking, Orlando was $116. Engine’s broader multi-month market average was $124.
All three figures can exist because they measure different dates, inventories, and rate samples. Demand tied to Walt Disney World, Universal Orlando Resort, school holidays, conventions, and weekend travel can produce sharp swings.
When budgeting for Orlando, compare the complete trip cost. A cheaper off-site room may require parking, rental-car, or rideshare spending, while a resort package may include transportation or early-entry benefits.
Warning: Do not treat a rate from one night as a yearly city average. Always check the exact dates, number of guests, room type, cancellation policy, and mandatory charges.
Virginia Beach: Seasonal Prices Matter

Virginia Beach was listed at $393.44 in the June 14–15, 2025 Booking.com snapshot that produced Orlando’s $401.14 figure. That number should not be presented as a 2026 annual average. In the broader October 2024 survey of 100 U.S. cities, Virginia Beach was $108 for the cheapest qualifying central double room.
The difference is a strong reminder that beach destinations are highly seasonal. Summer weekends, festivals, and oceanfront locations can be expensive, while fall and winter dates may be much cheaper.
Notable Attractions Nearby
Visit Virginia Beach currently describes the destination as having 38 miles of coastline, while the official oceanfront boardwalk stretches for three miles. The area also offers an aquarium, state-park trails, water activities, and family attractions.
| Attraction | What to Expect |
|---|---|
| Virginia Aquarium | Marine animals, exhibits, educational programs, tours, and other visitor experiences. |
| Virginia Beach Boardwalk | A three-mile oceanfront route with hotels, restaurants, public spaces, and recreation. |
| First Landing State Park | Trails, Chesapeake Bay beachfront, camping, and natural habitats. |
| Beach Activities | Swimming, surfing, kayaking, paddleboarding, and beach recreation. |
| Family Attractions | Seasonal entertainment, parks, museums, and oceanfront activities. |
Seasonal Tourism Trends
Summer is the main high-demand period for oceanfront lodging. Rates often rise for Friday and Saturday nights, school-holiday weeks, and major events. Travelers with flexible schedules should compare midweek dates and shoulder-season stays in late spring or early fall.
An oceanfront room may cost more than a property several blocks inland, but it can reduce parking and transportation needs. Compare the total convenience and trip cost instead of judging the room rate alone.
Recreational Activities Available
Visitors can surf, kayak, paddleboard, bike the boardwalk, explore the aquarium, or hike at First Landing State Park. The Neptune Festival and other scheduled events can increase lodging demand, so check the city’s event calendar before booking.
These activities help explain why Virginia Beach can command high peak-season prices, but they do not justify using a single expensive night as a year-round average.
How Do Major Events Influence Hotel Prices?
Hotels use demand-based pricing. When a convention, concert, sports event, graduation, or festival fills a large share of available rooms, lower-priced room types can sell first and the remaining inventory becomes more expensive.
CoStar’s June 2026 U.S. hotel-performance report provides a current example. The company reported that World Cup demand helped produce the strongest year-over-year monthly ADR and RevPAR increases since March 2023. San Francisco/San Mateo recorded a 21.7% ADR increase to $264.42, while Miami’s ADR rose 23.2% to $218.37.
- Limited inventory: Central neighborhoods have a fixed number of rooms at any given time.
- Compressed demand: Many visitors want the same dates and location.
- Fewer low rates: Lower-priced room types can sell earlier on busy dates.
- Stay restrictions: Some properties may use minimum-stay rules on high-demand dates.
Pro Tip: Search one day before and after your preferred dates. Moving a stay away from a major event night can reduce the total more than switching to a lower-rated hotel.
Comparing Chicago With Other Major Cities
Chicago averages $233 in Engine’s multi-month dataset, making it the fourth-most-expensive of those 50 markets. It was listed at $353.33 in the one-night June 14–15, 2025 Booking.com snapshot and at $176 in the October 2025 month-long city-center benchmark.
The differences do not prove that one source is wrong. They show how an exact weekend price, a month-long average of the cheapest qualifying central room, and a multi-month public-rate average answer different questions.
Rate Comparison Overview
Using the October 2025 methodology alone, Chicago’s $176 benchmark was below Boston at $375 and New York City at $338, but slightly above San Diego at $175 and above Los Angeles at $158. Miami was $134 in the same survey.
Using Engine’s multi-month data instead, Chicago is $233, behind New York, Boston, and Washington, D.C. This is why the dataset name and measurement period should always accompany a city ranking.
Factors Influencing Prices
Chicago hotel prices respond to conventions, trade shows, festivals, sports, business travel, neighborhood, and season. Downtown and convention-area properties may rise quickly when large events overlap.
Engine lists June as Chicago’s priciest month in its multi-month data. Travelers should still check their exact event dates because a major convention or sports weekend can produce a very different rate from the monthly pattern.
How Tourism Drives Hotel Prices Up
Tourism can push hotel prices higher when demand grows faster than room supply. The effect is strongest in central neighborhoods, during popular seasons, and when leisure travelers overlap with conventions or business travel.
- Major attractions: Landmarks and entertainment districts create steady demand.
- Seasonal travel: Beaches, fall foliage, holidays, and school breaks concentrate bookings.
- International and group travel: Large groups can absorb many rooms at once.
- Limited supply: Dense central areas cannot instantly add rooms when demand rises.
Tourism is only one factor. Operating costs, hotel class, neighborhood, taxes, local rules, events, and available inventory also affect the final price.
What Happened to San Diego Hotel Rates?
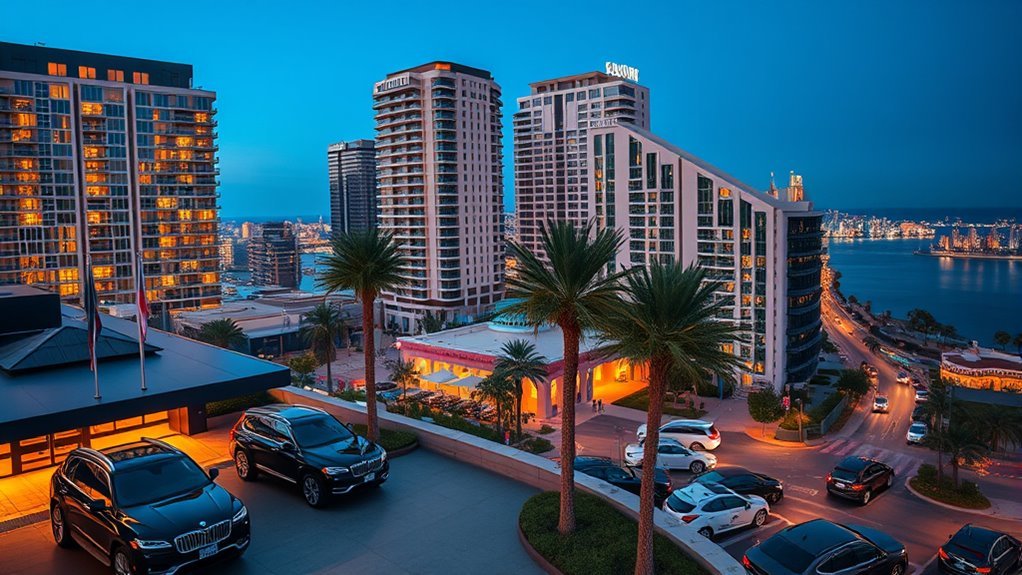
The original claim that San Diego hotel prices rose 31% was based on the October 2024 survey’s comparison with 2023. It should not be described as a current 2026 increase.
In that 2024 survey, San Diego’s benchmark was $177. In the October 2025 survey, it was $175 under a similar city-center, three-star-or-better method. Engine’s broader multi-month dataset places San Diego at $198 and lists July as its priciest month.
San Diego can still be expensive during summer, conventions, and special events. Travelers should treat every published figure as a comparison point and check live prices for their exact dates.
Which Months Are Most Expensive in Major U.S. Hotel Markets?
Engine’s multi-month dataset also reports each market’s priciest month. The pattern shows why one city can rank very differently depending on when a survey is conducted.
| Market | Priciest Month in Engine Data | Reported Seasonal Swing |
|---|---|---|
| New York | December | 64% |
| Boston | October | 64% |
| Washington, D.C. | May | 44% |
| Chicago | June | 60% |
| Palm Springs | March | 57% |
The takeaway is not that these months are always the costliest for every property. They are the peak months in this specific multi-month dataset. Events, room type, booking timing, neighborhood, and inventory can still override the broader seasonal pattern.
Exploring Regional and Seasonal Variations
City-market rankings do not capture every expensive U.S. vacation destination. In the August 2025 summer-destination survey, Nantucket averaged $621, Martha’s Vineyard $532, and Montauk $512 for the cheapest qualifying double room. Those destinations were much more expensive than the major-city figures in the October survey.
The two Cheaphotels.org surveys answer different questions. The city index compares selected urban destinations in October. The summer list focuses on vacation destinations near beaches or town centers in August and explicitly includes taxes and fees. For broader seasonal comparisons, see the site’s 2026 U.S. summer hotel cost guide.
Regional pricing can also reverse from year to year. San Francisco was $105 in October 2024 after a reported 20% decline, then rose to $134 in the October 2025 benchmark. Engine’s multi-month average for San Francisco is $165. Old figures should always be labeled with their methodology and measurement period.
Budgeting Tips for Expensive Hotel Cities
Set a total-stay budget rather than a room-only budget. Include government taxes, parking, transportation, breakfast, optional services, and cancellation risk. Since May 12, 2025, the Federal Trade Commission’s Rule on Unfair or Deceptive Fees has required businesses displaying short-term lodging prices to show the total price including mandatory charges that can be calculated upfront. Government taxes and genuinely optional add-ons may initially be excluded, but excluded charges must be disclosed before payment and the final amount must be shown before the customer pays.
| Budgeting Strategy | How It Helps |
|---|---|
| Compare several date combinations | Avoids event nights and expensive weekends. |
| Search by map | Shows whether a lower rate is still convenient for your plans. |
| Check the total price | Prevents mandatory fees, taxes, and parking from breaking the budget. |
| Compare refundable and prepaid rates | Balances savings against the cost of changing plans. |
| Compare hotels and short-term rentals | A rental may offer more space, but cleaning charges, transportation, and location can erase the savings. |
| Review loyalty and direct-booking offers | May add breakfast, upgrades, points, or flexible terms. |
Google Hotels can help travelers compare lodging by destination, dates, price, rating, class, location, and amenities. Hotel prices can change quickly, so confirm the final room type, cancellation terms, charges, and amount due on the booking page.
For a complete trip-level approach, use the site’s guide to budgeting for hotel costs on a U.S. vacation rather than setting a budget from one nightly-rate statistic.
Frequently Asked Questions
Which U.S. city has the most expensive hotels in 2026?
There is no universal ranking because datasets use different methodologies. In Engine’s multi-month dataset covering 50 U.S. markets through April 2026, New York ranks first at $336 per night and Boston second at $311. In the separate October 2025 Cheaphotels.org city-center survey, Boston ranked first at $375 and New York second at $338.
Why are Boston hotel prices so high in this ranking?
The $375 Boston figure comes from an October survey of central hotels rated at least three stars. Engine’s broader data also lists October as Boston’s priciest month and gives the city a lower multi-month average of $311. That shows how the October-only methodology can amplify Boston’s position.
What is the most expensive hotel in America per night?
This city-price data cannot answer that question. It compares city or market lodging rates, not individual hotels or specialty suites. The most expensive property can change by date, room category, package, and availability.
What U.S. city has the cheapest hotels?
It depends on the dataset. In Engine’s multi-month comparison of 50 major U.S. markets, Oklahoma City is lowest at $97 per night. In Cheaphotels.org’s October 2024 survey of 100 U.S. cities, Reno was lowest at $87 for the cheapest qualifying central double room.
Are hotel taxes and resort fees included in these prices?
It depends on the dataset. The October 2025 Cheaphotels.org city survey does not clearly state on its methodology page whether taxes and fees are included, while its August 2025 summer-destination survey explicitly says they are. For actual U.S. bookings, mandatory calculable lodging charges should be included in the prominently displayed upfront total under the FTC fee rule, while government taxes and genuinely optional additions may initially be shown separately.
When are hotels most expensive?
The peak month varies by market. Engine’s multi-month data lists December for New York, October for Boston, May for Washington, D.C., June for Chicago, and March for Palm Springs. Rates can rise further during conventions, graduations, concerts, holidays, major sports events, and other high-demand dates.
Conclusion
New York and Boston are the clearest high-cost U.S. hotel markets across the current datasets, but their order changes with methodology. Engine’s multi-month data ranks New York first at $336 and Boston second at $311, while the October 2025 Cheaphotels.org city-center survey puts Boston first at $375 and New York second at $338.
That difference is the key lesson: no hotel-price ranking is a fixed 2026 rate card. Use rankings to identify potentially expensive destinations, then compare the total price for your exact dates, neighborhood, room type, guest count, cancellation terms, government taxes, and optional costs before booking.
Sources
- Engine Data: Average Hotel Prices by City — 128,536,941 public-rate observations across 50 U.S. markets from May 2024 through April 2026, including average rates and seasonality.
- Cheaphotels.org Hotel Price Index 2025 — October 2025 city rates and methodology.
- Cheaphotels.org U.S. City Survey 2024 — 100-city benchmark and prior-year comparisons.
- Cheaphotels.org Summer Destinations Survey 2025 — peak-summer destination rates and fee treatment.
- Mental Floss: 25 U.S. Cities With the Most Expensive Hotels — Gourmet Marketing’s June 14–15, 2025 Booking.com snapshot and methodology.
- CoStar and Tourism Economics 2026 U.S. Hotel Forecast — updated national hotel-rate and demand outlook.
- CoStar U.S. Hotel Performance for June 2026 — ADR, occupancy, RevPAR, and major-event effects.
- Federal Trade Commission Fee Rule — effective date and hotel-fee disclosure requirements.
- FTC Fee Rule Frequently Asked Questions — mandatory fees, government charges, optional additions, and final-price disclosure.
- Google Travel Help: Search for Hotels — hotel search and comparison guidance.
- Visit Virginia Beach — current coastline and destination information.