
Living in Richmond, Virginia offers an attractive blend of historic charm, thriving job markets, and mid-Atlantic convenience—all at a cost that sits comfortably below national standards. Overall, the cost of living in Richmond, VA is approximately 5.0% to 5.6% lower than the U.S. average, making it one of the most budget-friendly metropolitan areas on the East Coast. Whether you are planning a solo relocation, buying your first home, or moving a family, understanding line-item expenses—from rent and utility bills to property taxes—will help you build an accurate financial plan.
Quick Answer
The cost of living in Richmond, VA is about 5.6% below the national average. A single adult needs a comfortable salary of $55,000 to $57,500 annually. Average monthly apartment rent sits at $1,402–$1,438 (roughly 13.5% below national norms), while median home prices range between $367,000 and $419,000. Public transit on GRTC buses is currently 100% fare-free.
Key Takeaways
- Overall Index: Richmond scores ~94.8–95.8 on the Cost of Living Index (100 = U.S. average).
- Housing & Rent: Average rent is $1,438/month, and housing expenses run 14%–19% below national averages.
- Zero-Fare Transit: GRTC local buses and the Pulse BRT line operate with $0 fares through FY2027.
- Healthcare & Utilities: Doctor visits average $119–$135 (~18% below national rates), while utilities sit ~4% below national averages.
At a Glance
| Overall Cost Index | 5.0%–5.6% below U.S. average (Index ~94.8–95.8) |
| Comfortable Single Salary | $54,936 – $57,516 / year |
| Average Monthly Rent | $1,402 – $1,438 / month |
| Median Home Price | $367,000 – $419,000 |
| Local Public Transit Fare | $0.00 (GRTC Zero-Fare system active) |
| City Property Tax Rate | $1.20 per $100 of assessed value |
Cost of Living Overview for Richmond, VA

Because Richmond’s overall cost of living sits about 5.0% to 5.6% below the U.S. average (index ~94.8–95.8), you’ll generally pay less here than in major East Coast hubs like Washington, D.C. or New York City. That relative affordability shows up clearly in both rental markets and homeownership figures: average monthly rent runs roughly $1,402–$1,438 (about 13.5% below the national average of $1,663), while median home prices sit around $367,000–$419,000 compared to national medians exceeding $450,000.
Expect housing to represent the single largest variable in your monthly budget. Data from economic benchmarking reports indicates that a comfortable annual salary for a single adult in Richmond is between $54,936 and $57,516. A typical renter household basic budget totals roughly $3,200 to $4,500 monthly depending on discretionary choices (including housing at ~$1,400–$1,977; groceries at ~$688; utilities at ~$363–$385; and transportation at ~$374). Understanding local neighborhood market conditions ensures you can choose an area that aligns with both your lifestyle and financial goals.
Homeowner baseline expenses are higher overall due to mortgage principal, interest, real estate taxes, and insurance, with typical single-family basic monthly costs running between $3,200 and $4,200. Use these baseline figures to compare neighborhoods across Richmond City, Henrico County, and Chesterfield County.
Monthly Budget Breakdown for a Single Adult

To construct an accurate monthly budget in Richmond, start with essential line items: housing, groceries, utilities, transportation, and healthcare.
Housing remains the largest expense—plan on allocating $1,402–$1,573/month for standard apartment leases (or up to $1,977/month if aiming for luxury high-rises or prime locations like Scott’s Addition). Groceries for a single adult typically require around $350–$688 per month depending on dining habits and household size.
Adding essential utilities (~$360–$400/month) and vehicle/commuting expenses (~$374/month) creates a reliable baseline cost framework.
Essential Monthly Expenses
Housing will be your dominant expenditure as a renter in Richmond. Expect baseline rents between $1,402 and $1,438 for one-bedroom units, leading to a total baseline budget for essentials near $3,200–$3,800/month.
For essential groceries, data from the Council for Community and Economic Research (C2ER) shows Richmond food prices sitting roughly 0.5% to 1.0% below national levels.
Utilities (electric, water, sewer, internet, phone) average roughly $363–$385 combined—with electric/energy averaging ~$198–$215 and phone/internet running ~$188–$190.
Healthcare expenses sit well below national averages (a routine doctor visit averages ~$119–$135, roughly 18% cheaper than national benchmarks), making routine care and insurance copays noticeably more affordable.
Housing and Rent
Plan your housing budget around the citywide rent average of $1,402–$1,438 per month. Keep in mind that neighborhood location dramatically impacts prices—ranging from ~$847–$1,229 in outer or lower-cost communities to ~$1,182 for inner-city studios and over $2,000 for three-bedroom units downtown or in historic districts.
For a single earner, financial planners recommend limiting housing costs to 30% of gross income. A comfortable salary target of $55,000 to $57,500 ensures rent payments remain stress-free.
For homeowners, median listing prices near $419,000 remain about 15% to 19% below national averages. Combining principal, interest, property taxes, and home insurance results in average monthly ownership payments of ~$2,700–$3,200.
Note: Richmond City assesses real estate tax at $1.20 per $100 of assessed value. On a median $350,000 property, property taxes total approximately $4,200 annually ($350/month). Surrounding counties like Henrico ($0.85/$100) and Chesterfield ($0.91/$100) maintain lower rates.
Transportation & Utilities
While Richmond’s transit and utility bills sit below national averages, precise planning prevents seasonal surprises. Expect basic utilities (energy, water, trash, sewer) to run $155–$215 monthly depending on home size and heating type. Energy costs average ~$198/month, while high-speed broadband internet adds ~$65/month.
Transportation options in Richmond offer significant savings opportunities:
- Public Transit (GRTC): All local bus routes and the GRTC Pulse Bus Rapid Transit system are 100% Zero-Fare ($0.00) through FY2027, fully funded by municipal and state grants.
- Driving: Gas prices average $2.98–$3.17 per gallon (~2% below national rates). Average commute time is roughly 21 minutes each way.
- Combined Impact: Richmond’s total transportation index is 1% to 2.4% below U.S. averages.
Rental Market: Average Rent and What to Expect
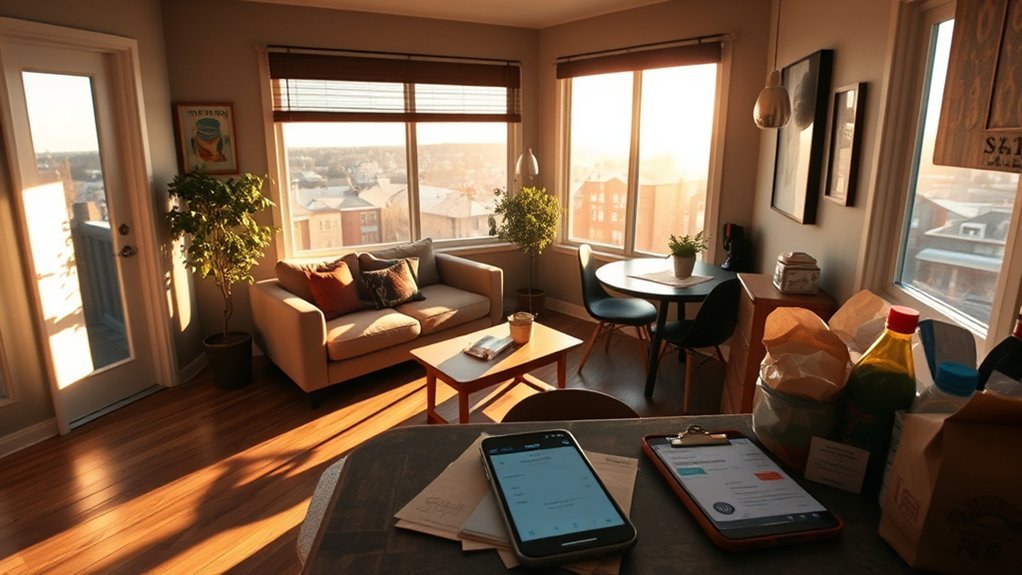
You’ll typically pay between $1,402 and $1,438 monthly for an average apartment in Richmond—roughly 13.5% below the national average. The median apartment size is approximately 684 to 862 square feet.
Prices vary significantly across unit layouts and neighborhoods. Studios average $1,235–$1,270, one-bedrooms cost ~$1,402–$1,438, two-bedrooms average ~$1,574–$1,618, and three-bedrooms run from $1,994 to $2,268+ per month.
Always verify whether advertised rent covers extra amenities or if separate fees apply for parking spaces, pet rent ($25–$50/mo), and submetered water usage.
Average Monthly Rent
Richmond rental prices offer steady savings compared to northern Virginia and D.C. markets. Market reports show 44% of apartments fall between $1,000 and $1,500/month, while 37% fall between $1,500 and $2,000/month.
- Studios: ~$1,186–$1,270/mo.
- 1-Bedrooms: ~$1,402–$1,438/mo (Average size: 684 sq ft).
- 2-Bedrooms: ~$1,574–$1,618/mo.
- 3-Bedrooms: ~$1,994–$2,268/mo.
Rent by Neighborhood
Rents vary substantially by neighborhood, reflecting proximity to Virginia Commonwealth University (VCU), dining corridors, and historic landmarks. Lower-cost neighborhoods average $847–$1,229/month, mid-range professional districts run $1,320–$1,594/month, and high-demand historic or nightlife districts top $1,760–$1,940/month.
| Neighborhood Tier | Example Areas | Typical Unit Type | Average Monthly Rent |
|---|---|---|---|
| Lower-Cost | Afton, British Camp Farms, Northside | 1 BR / 2 BR | $847 – $1,229 |
| Mid-Range | Shockoe Bottom, Old Town Manchester, East End | Studio / 1 BR | $1,439 – $1,594 |
| High-Cost / Trendy | Scott’s Addition, Museum District, Downtown | 1 BR / 2 BR Luxury | $1,761 – $1,940 |
| City Center / Historic | The Fan, Monroe Ward, Jackson Ward | 2–3 BR Rowhouse | $1,800 – $2,268+ |
What Rent Covers
When budgeting for rent in Richmond, assume base advertised rent covers only physical occupancy. Most landlords exclude utilities and optional building amenities.
- Electricity & Gas: $155–$215/month extra.
- Internet & Cable: $65/month average for 60–100 Mbps plans.
- Trash & Water: Often billed back via ratio utility billing systems ($30–$50/mo).
- Parking & Pets: Reserved garage spaces cost $75–$150/mo downtown; pet fees average $25–$50/mo plus non-refundable deposits.
Homebuying and Typical Mortgage Costs

While home prices in Richmond remain lower than in many mid-Atlantic metros, purchasing a home requires careful calculation of principal, interest, taxes, and maintenance reserve funds. The average home listing price sits around $418,000 to $448,000, with median selling estimates ranging between $367,000 and $419,000.
Richmond homes cost 15% to 19% less than national averages, with monthly mortgage principal and interest payments averaging $2,700–$2,800 on a median home loan.
When modeling homeownership expenses, factor in property tax rates ($1.20 per $100 assessed value in Richmond City; ~$3,960–$4,200/year on a $330,000–$350,000 home), homeowner’s insurance ($1,200–$1,800/year), and optional HOA dues in newer developments.
Overall, housing costs in Richmond run 14% to 20% below national norms, allowing buyers to get substantially more square footage and yard space compared to northern markets.
Groceries and Food Prices in Richmond

Grocery costs in Richmond sit 0.5% to 1.0% below the national average according to C2ER price surveys. Everyday supermarket staples remain affordable across regional chains like Kroger, Publix, Wegmans, and local markets.
- Loaf of Bread: ~$4.00 – $4.07
- Gallon of Milk: ~$4.65 – $4.79
- Dozen Eggs: ~$3.38 – $4.37
- Ground Beef (1 lb): ~$6.99 – $7.59
- Boneless Chicken Breast (1 lb): ~$1.62 – $3.99
Individual food spending averages roughly $350 per month per adult, while a full family of four can expect monthly grocery bills of $1,100 to $1,350.
Utilities and Monthly Household Bills

Household utilities in Richmond run approximately 3.5% to 4.0% below national averages. Electricity and heating expenses fluctuate seasonally due to hot, humid summers and mild winters.
Average electric bills run ~$198–$215 per month for standard single-family homes. Water and sewer billing through the Richmond Department of Public Utilities includes a fixed meter charge ($18.92 for 5/8″ meters) plus consumption and stormwater management fees ($2.43/mo for single-family residences).
Pro Tip: Natural gas usage spikes during winter months. Enrolling in Dominion Energy’s or Richmond DPU’s budget billing programs helps equalize utility payments across all 12 months, preventing unexpected winter spikes.
Healthcare, Insurance, and Medical Costs

Healthcare expenses in Richmond are notably lower than in surrounding metropolitan areas. Overall healthcare indexes sit about 11% below national averages, driven by strong competition among top regional hospital networks including VCU Health System, Bon Secours, and HCA Virginia.
- Routine Doctor Visit: ~$119 – $135 (~18% below U.S. average)
- Dental Exam & Cleaning: ~$104 – $117 (~10% below U.S. average)
- Optometrist Visit: ~$131 – $164
- Prescription Drugs / OTC Meds: Roughly on par with national baselines.
Transportation, Commuting, and Vehicle Expenses

Transportation expenses in Richmond sit 1% to 2.4% below national averages. Commuting is generally efficient thanks to the intersection of Interstates 95, 64, and 295, with average one-way drive times of just 21 minutes.
Vehicle maintenance expenses sit slightly below national rates—for instance, tire balancing averages $56–$61 compared to $66 nationally. Gas prices range from $2.98 to $3.17 per gallon.
Warning: The City of Richmond levies an annual personal property tax (often called the “car tax”) on motor vehicles registered within city limits. Factor in roughly $3.70 per $100 of assessed vehicle value into your yearly auto budget.
Goods, Services, Entertainment, and Personal Care

Everyday consumer goods, personal services, and entertainment options in Richmond align closely with national benchmarks (index ~99.8). Richmond features a vibrant cultural, craft brewery, and culinary scene that remains accessible for mid-range budgets.
- Movie Ticket: ~$13.00 – $15.29
- Haircut (Men’s / Standard): ~$26.91 – $27.99
- Beauty Salon Styling: ~$48.38 – $51.46
- Gym Membership: ~$33.25 – $50.00 / month
- Dry Cleaning (Shirt/Suit): ~$15.46 – $16.99
Frequently Asked Questions
How does Richmond’s cost of living compare to nearby cities like Charlottesville?
Richmond’s overall cost of living is noticeably lower than Charlottesville’s, particularly in real estate. Charlottesville housing sits roughly 15%–25% higher due to university-driven demand. Richmond offers a broader job market, more diverse housing options, and urban amenities at lower overall prices.
Are there seasonal rent fluctuations I should expect in Richmond?
Yes. Due to VCU’s large student population (over 28,000 students) and young professional moves, leasing demand spikes between May and August. Rent prices peak during summer, while securing a lease in late fall or winter often yields better deals and landlord concessions.
What neighborhoods are safest yet affordable for young professionals?
Popular neighborhoods for young professionals include The Fan, Museum District, Scott’s Addition, Shockoe Bottom, and Manchester. Shockoe Bottom and Manchester offer lower rent thresholds, while Scott’s Addition and The Museum District command higher premiums for walkable dining and brewery access.
How much do pet-related expenses add to a monthly budget?
Pet owners should budget an extra $75 to $200 monthly per pet. Typical rental properties charge a non-refundable upfront pet fee ($250–$350) plus $25–$50/month in pet rent. Veterinary checkups in Richmond average ~$78.
Are short-term furnished rentals significantly more expensive than long-term leases?
Yes. Short-term or corporate furnished rentals in Richmond carry a 20% to 50% monthly premium over traditional 12-month leases due to included utility packages, furnishings, and tenant turnover costs.
Conclusion
Planning a move to Richmond, VA reveals a city where income stretches farther than in most East Coast urban centers. With average rent sitting around $1,400–$1,438, median home prices lingering under $420,000, and zero-fare public bus transportation, residents enjoy a balanced quality of life. By accounting for specific line items like property taxes and seasonal utility shifts, you can confidently structure a comfortable monthly budget tailored to your financial goals.
Sources
- Greater Richmond Partnership / C2ER Cost of Living Index Report — Regional cost benchmark data for Richmond MSA
- Greater Richmond Transit Company (GRTC) Zero-Fare Announcement — Verification of $0 transit fare program status
- U.S. Census Bureau QuickFacts: Richmond City, VA — Demographic, median home value, and income stats
- U.S. Bureau of Labor Statistics (BLS) Mid-Atlantic Region — Employment and price trend statistics for Richmond, VA