
The Fremont, CA cost of living is high mainly because of housing. As of August 31, 2026, RentCafe reports an average apartment rent of $2,956 per month and a one-bedroom average of $2,634. Under the 30% rent guideline, those figures imply about $118,240 and $105,360 in gross annual income. Redfin reports a July 2026 median home sale price of $1,499,249. This guide combines those Fremont-specific housing figures with Census data, local utility and transit rates, and MIT’s Alameda County basic-needs model. Because the sources use different methodologies, treat the totals as planning estimates rather than one official citywide budget.
Last updated: September 7, 2026
Author: Theo Ramirez
Quick Answer
In 2026, Fremont remains an expensive Bay Area housing market. RentCafe’s August 31 update puts average apartment rent at $2,956 a month, implying about $118,240 in gross annual income under the 30% rent guideline. Redfin’s July 2026 median home sale price is about $1.50 million. Childcare, transportation, food, healthcare, and utilities can add thousands more each month.
Key Takeaways
- RentCafe’s August 31, 2026 update lists average apartment rent at $2,956, while a one-bedroom averages $2,634.
- Keeping average apartment rent near 30% of gross income requires roughly $118,240 per year.
- Fremont’s July 2026 median home sale price was about $1.50 million.
- MIT estimates that one adult needs about $67,204 in gross annual income for basic needs across Alameda County, but Fremont-specific rent can push the practical target higher.
- Two working adults with two children need about $185,729 in gross income for the MIT basic-needs budget, before extra savings, debt payments, or premium housing choices.
Note: These are financial-planning estimates, not personal financial, tax, mortgage, or legal advice. Your actual costs will depend on household size, debt, credit, insurance, taxes, commute, benefits, lease terms, and lifestyle.
Fremont Cost of Living at a Glance

There is no single official Fremont cost-of-living index. Private index providers use different expense baskets and update schedules, so their scores are not always comparable. A more reliable planning approach is to combine current housing data with official income, utility, transit, tax, and household-expense sources.
The U.S. Census Bureau reports a Fremont median household income of $181,506 in 2024 dollars, a median gross rent of $2,933 for 2020–2024, and a median owner-occupied home value of $1,403,800. Current asking rents and sale prices can be higher because Census figures cover a multi-year period.
| 2026 planning figure | Amount | What it measures |
| Average apartment rent | $2,956/month | RentCafe apartment inventory, August 31, 2026 |
| Average one-bedroom rent | $2,634/month | RentCafe apartment inventory, August 31, 2026 |
| Median gross rent | $2,933/month | Census renter households, 2020–2024 |
| Median home sale price | $1,499,249 | Redfin sales data, July 2026 |
| Median household income | $181,506/year | Census estimate in 2024 dollars |
| One-adult basic-needs income | $67,204/year | MIT Alameda County model |
Fremont renter reality check: MIT’s one-adult Alameda County model assumes about $2,152 per month for housing, while RentCafe’s current Fremont one-bedroom average is $2,634. If you hold every other MIT expense category unchanged and swap in the Fremont one-bedroom figure, the modeled after-tax monthly expense total rises from about $4,541 to about $5,023. This is a simple Fremont housing adjustment for planning, not an MIT estimate.
These numbers answer different questions. Census median gross rent describes what renter households paid over a multi-year period, while RentCafe measures apartment communities in its covered inventory. Other listing-based rental services can cover different property types and time windows. Always compare the date, unit type, and methodology before using a rent figure in your budget.
How Much Does Housing Cost in Fremont?

Housing is the main reason Fremont costs more than many U.S. cities. Redfin reports a median sale price of $1,499,249 for the three months ending July 2026. The Census Bureau’s 2020–2024 median value for owner-occupied housing was $1,403,800, which reflects a different period and methodology.
A buyer should budget for more than the listed home price. Typical ownership costs may include:
- Down payment and closing costs
- Mortgage principal and interest
- Property tax and local assessments
- Homeowners insurance
- HOA dues, when applicable
- Repairs, maintenance, and appliance replacement
Median-Price Home Example
The following example uses Fremont’s July 2026 median sale price, a 20% down payment, a 30-year mortgage, and the 6.71% national average mortgage rate reported by Freddie Mac on September 3, 2026.
- Home price: $1,499,249
- 20% down payment: approximately $299,850
- Loan amount: approximately $1,199,399
- Estimated principal and interest: approximately $7,747 per month
- Base property tax at 1%: approximately $1,249 per month
- Subtotal before insurance, assessments, HOA dues, and maintenance: approximately $8,997 per month
California’s Proposition 13 framework generally sets the base property-tax rate at 1% of assessed value, plus voter-approved bonded debt and other assessments. Therefore, the final property-tax bill can exceed the simple 1% estimate.
Under these assumptions, keeping the estimated $8,997 housing subtotal near 30% of gross income would require roughly $359,900 a year, before homeowners insurance, HOA dues, maintenance, and other debts.
The 30% guideline is a budgeting reference, not a mortgage-approval rule. Lenders consider credit, down payment, taxes, insurance, existing debts, reserves, and other underwriting factors.
How Much Is Rent in Fremont, CA?
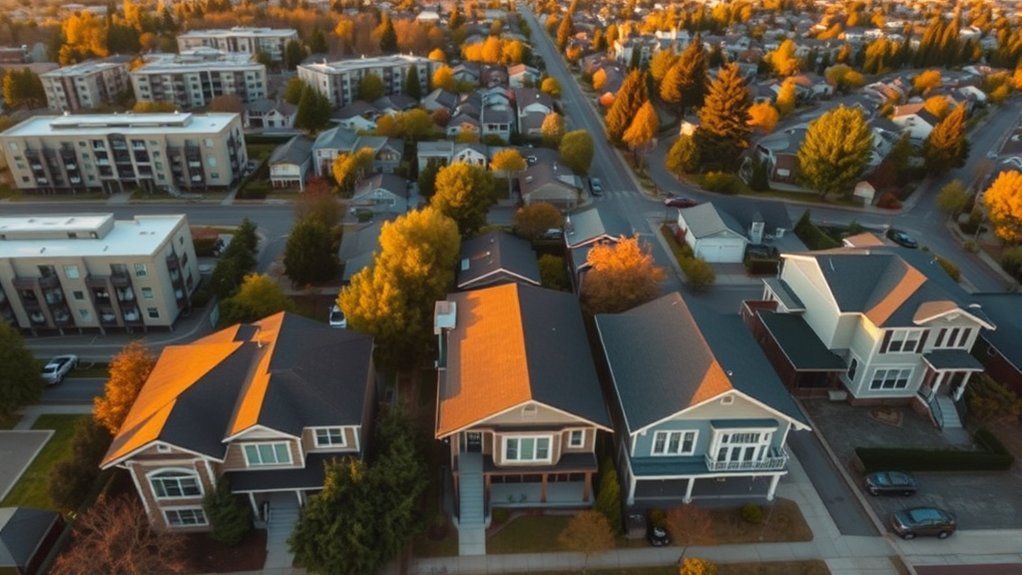
According to RentCafe’s August 31, 2026 market report, the average Fremont apartment rent was $2,956 per month. The data covers apartment buildings in RentCafe and Yardi Matrix’s tracked inventory, with a strong focus on communities containing 50 or more units.
Rent by Apartment Size
| Apartment type | Average monthly rent | Gross annual income at 30% |
| Studio | $2,226 | $89,040 |
| One bedroom | $2,634 | $105,360 |
| Two bedrooms | $3,237 | $129,480 |
| Three bedrooms | $3,974 | $158,960 |
| All apartments | $2,956 | $118,240 |
The income column uses a simple calculation: monthly rent × 12 ÷ 0.30, which is the same as multiplying monthly rent by 40. Your personal housing limit may need to be lower if you have childcare, debt payments, medical costs, or aggressive savings goals.
Neighborhood Rent Examples
| Neighborhood | Average rent |
| Cabrillo | $2,419 |
| Glenmoor | $2,487 |
| Sundale | $2,521 |
| Downtown Fremont | $3,243 |
| Cherry–Guardino | $3,272 |
| East Industrial | $3,589 |
Neighborhood averages do not control for bedroom count, building age, square footage, parking, pet policies, or included utilities. Compare similar units and focus on the total move-in and monthly cost.
Pro Tip: Ask each property for a written fee sheet covering base rent, deposit, parking, pets, utilities, internet requirements, application charges, renter’s insurance, and renewal terms. A lower advertised rent can cost more after mandatory monthly fees.
How Much Are Utilities, Internet, and Phone in Fremont?

There is no dependable flat utility average for every Fremont household. Renters may have water, trash, or gas included in rent, while homeowners usually pay more services directly. Electricity also varies sharply with home size, insulation, air conditioning, electric vehicles, appliances, solar production, and rate plan.
Typical Utility Breakdown
- Electricity and gas: Usage varies. As of March 2026, PG&E says most residential customers pay a base services charge of about $24 per month, with energy usage billed separately.
- Water: The Alameda County Water District reports an average single-family bill of $155.03 every two months, equal to about $77.52 per month. Actual bills depend on meter size and water use.
- Trash, recycling, and organics: Fremont’s 2026–2027 single-family rates range from $47.89 monthly for a 20-gallon trash cart to $76.36 for a 96-gallon cart.
- Internet and mobile service: MIT’s Alameda County model budgets $1,924 per year, or about $160 per month, for internet and mobile service combined for one adult.
For a household paying these services separately, the current benchmarks add up quickly: ACWD’s average water bill is about $77.52 per month, Fremont’s lowest single-family trash rate is $47.89 per month, MIT budgets about $160 per month for internet and mobile service for one adult, and PG&E says most residential customers pay a base services charge of about $24 per month before electricity usage. That is already about $309 per month before energy consumption. Renters may pay less when water or trash is included in rent, while larger homes, electric vehicles, multiple phone lines, or heavy energy use can push the total higher.
Internet and Phone Rates
Internet and phone prices depend on speed, equipment rental, taxes, promotional periods, device financing, number of lines, and employer discounts. A claim that one cellphone line normally costs $190 per month is not supported by the available Alameda County basic-needs data. MIT’s approximately $160 monthly figure covers internet and mobile service together for one adult.
Before signing a lease, confirm whether the building requires a specific internet provider and whether any technology or smart-home fee is mandatory. For mobile service, compare prepaid plans, multi-line discounts, employer programs, and the full price after promotions expire.
Groceries, Dining Out, and Everyday Essentials
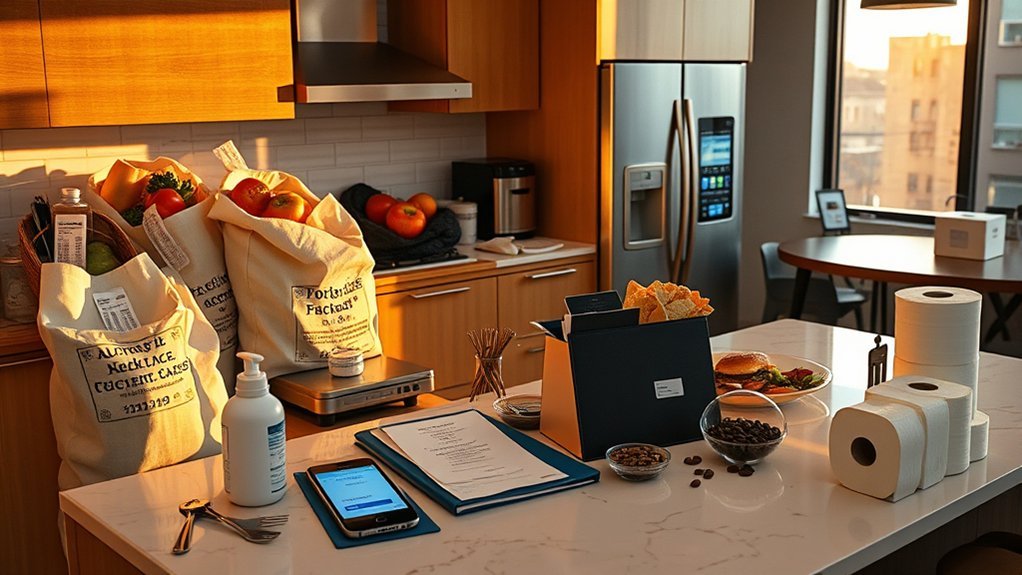
Food costs depend on household size, dietary needs, store choice, and how often you eat out. The MIT Living Wage Calculator for Alameda County, updated February 15, 2026, provides the following basic food budgets:
| Household | Annual food budget | Monthly equivalent |
| One adult | $5,083 | About $424 |
| One adult and one child | $7,456 | About $621 |
| Two adults | $9,318 | About $777 |
| Two adults and two children | $14,875 | About $1,240 |
These are basic at-home food estimates, not dining-out budgets. Restaurant meals, delivery charges, tips, specialty diets, alcohol, and convenience purchases require additional money.
To control food spending:
- Plan meals around weekly promotions and ingredients you will use fully.
- Compare unit prices rather than package prices.
- Use warehouse stores only when the quantity will not create waste.
- Set a separate dining-out amount so restaurant spending does not quietly consume the grocery budget.
- Track delivery fees and tips, which can make a modest meal much more expensive.
How Much Does Transportation Cost in Fremont?
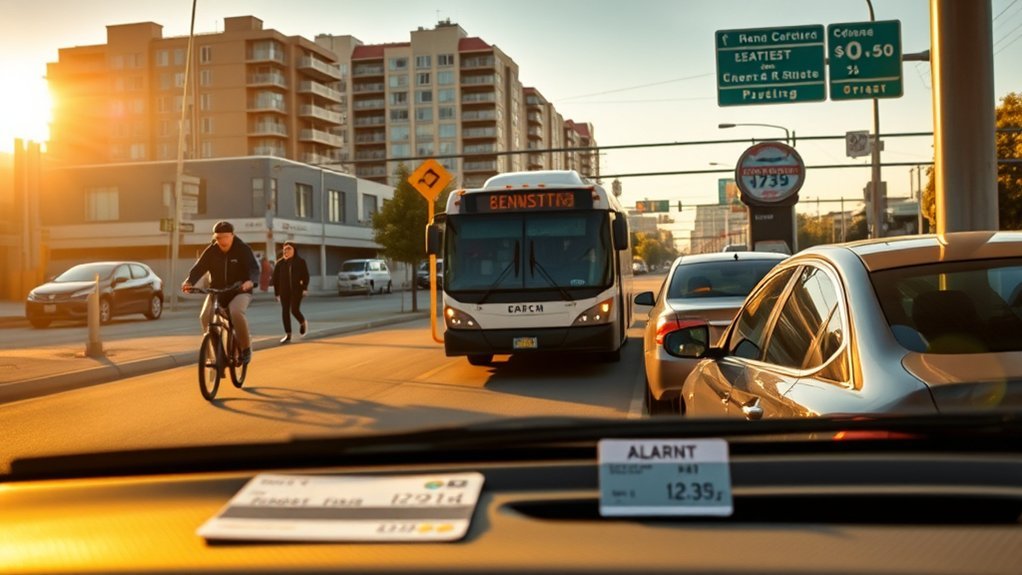
Fremont residents may use BART, AC Transit, employer shuttles, bicycles, rideshares, or personal vehicles. The Census Bureau reports a mean commute time of 30.3 minutes for Fremont workers in its 2020–2024 data.
Public Transit
BART fares are distance-based. BART does not offer a general weekly or monthly pass, so the cost depends on your origin, destination, and number of commuting days. Use BART’s fare calculator for the route you expect to take.
AC Transit fares effective July 1, 2026 include:
- Local single ride: $2.75 with Clipper or contactless payment
- Local daily fare maximum: $6
- Local monthly fare maximum: $99
- Transbay monthly fare maximum: $234
Eligible low-income riders may qualify for reduced fares through Clipper START. Youth, seniors, and qualifying riders with disabilities may also receive discounts.
Driving Costs
A car budget must include more than gasoline. Add insurance, registration, maintenance, tires, repairs, depreciation, parking, tolls, and financing. Gas prices change daily, so a fixed price quickly becomes stale.
MIT’s 2026 Alameda County model estimates transportation expenses of:
- One adult: $9,043 per year, or about $754 per month
- One adult and one child: $10,466 per year, or about $872 per month
- Two adults and two children: $15,169 per year, or about $1,264 per month
Your cost may be lower if you can walk, cycle, telecommute, or rely mainly on transit. It may be higher if the household needs two financed vehicles or regularly crosses toll bridges.
How Much Do Healthcare and Childcare Cost in Fremont?
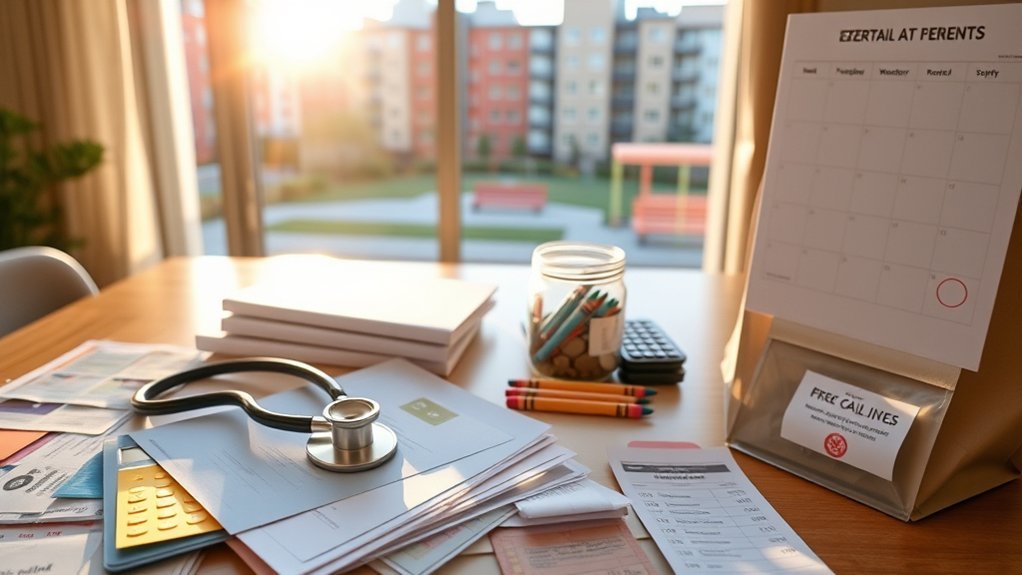
Childcare is one of the largest non-housing expenses for Fremont families. Prices differ by child age, care type, schedule, provider, subsidies, and whether an employer offers dependent-care benefits.
Childcare Benchmarks
MIT’s 2026 Alameda County model estimates:
- One child: $22,168 per year, or about $1,847 per month
- Two children: $46,566 per year, or about $3,881 per month
- Three children: $66,804 per year, or about $5,567 per month
These are modeled basic-needs costs, not quotes from a specific Fremont provider. Families should request current rates, ask about registration and supply fees, confirm holiday and closure policies, and join waitlists early.
Healthcare Benchmarks
MIT’s medical category includes expected insurance and out-of-pocket costs rather than only an insurance premium. Its annual estimates include:
- One adult: $3,752 per year, or about $313 per month
- One adult and one child: $12,255 per year, or about $1,021 per month
- Two adults and two children: $13,522 per year, or about $1,127 per month
Actual healthcare spending depends on employer contributions, plan type, deductibles, prescriptions, dental and vision coverage, chronic conditions, and use of care. Compare the annual premium, deductible, copays, coinsurance, and out-of-pocket maximum rather than focusing only on the monthly premium.
What Salary Do You Need to Live in Fremont?
The Census Bureau reports a Fremont median household income of $181,506 and per-capita income of $77,049, both in 2024 dollars. Household income includes all earners in the household, so it should not be treated as the average salary of one worker.
Salary Benchmarks by Situation
| Situation | Gross annual benchmark | What it means |
| One adult, basic needs | $67,204 | MIT Alameda County estimate using a countywide housing assumption |
| Studio renter at 30% | $89,040 | Based only on average studio rent |
| One-bedroom renter at 30% | $105,360 | Based only on average one-bedroom rent |
| Average apartment at 30% | $118,240 | Based on $2,956 monthly rent |
| One adult and one child | $130,068 | MIT basic-needs estimate |
| Two working adults and two children | $185,729 combined | MIT basic-needs estimate |
| Median-price home example | About $359,900+ | 30% benchmark before insurance, HOA, maintenance, and other debts |
A “comfortable” income is higher than a basic-needs income when you want retirement contributions, emergency savings, travel, private lessons, premium childcare, debt repayment, or a larger home.
Taxes to Include
- California income tax: For 2026 estimated tax, the California Franchise Tax Board’s 2026 Form 540-ES instructions tell residents to use the 2025 tax table. Those schedules use marginal rates from 1% to 12.3%, and a separate 1% Behavioral Health Services Tax applies to taxable income above $1 million.
- Sales tax: The California Department of Tax and Fee Administration lists Fremont’s combined sales-and-use tax rate at 10.25%.
- Property tax: The base California rate is generally 1% of assessed value, plus voter-approved debt and assessments.
- Payroll and federal taxes: These further reduce take-home pay and depend on earnings, filing status, benefits, and deductions.
Sample Monthly Budgets by Household Type
MIT’s figures provide a consistent basic-needs model for Alameda County. They are not luxury budgets and do not represent every Fremont household. The monthly figures below are annual required expenses after taxes divided by 12.
| Household | Basic monthly expenses after tax | Required gross annual income |
| One adult, no children | About $4,541 | $67,204 |
| One adult, one child | About $8,749 | $130,068 |
| Two working adults, no children | About $6,221 | $87,820 combined |
| Two working adults, two children | About $12,367 | $185,729 combined |
MIT’s one-adult model assumes annual housing expenses of $25,818, or about $2,152 monthly. That is about $483 below RentCafe’s current Fremont one-bedroom average of $2,634. Holding the other MIT categories unchanged would raise the modeled one-adult after-tax monthly expense total from about $4,541 to about $5,023. This is a simple planning adjustment, not an MIT estimate; actual taxes and household costs will vary.
Weighing Lifestyle Benefits Against the Costs

Many households consider Fremont because of its Bay Area location, BART access, parks, established neighborhoods, schools, and proximity to employment centers. Whether those benefits justify the price depends on where you work, how much space you need, and which services matter most to your household.
Consider the complete tradeoff:
- Housing: Renting alone often requires a six-figure income under the 30% guideline, while buying the current median-priced home requires a large down payment and substantial monthly cash flow.
- Commute: Living near BART or work may justify higher rent if it allows you to avoid a second vehicle, parking, fuel, and toll costs.
- Family expenses: Childcare can cost more than rent in some households, making provider availability as important as housing price.
- Space: A smaller home in a preferred area may cost more than a larger home farther from work.
- Savings: A budget that technically covers monthly bills may still be too tight if it leaves no room for retirement, emergencies, repairs, or job changes.
Check school boundaries, commute times, transit access, insurance quotes, noise, parking, and nearby services for the exact address. Citywide averages cannot show those neighborhood-level differences.
Ways to Lower Your Fremont Living Costs
- Compare total rent, not advertised rent. Include parking, pets, utilities, required internet, renter’s insurance, and renewal increases.
- Consider a studio, roommate, or older building. Reducing rent usually has a larger effect than cutting small discretionary purchases.
- Test the commute before moving. A lower-rent unit can become more expensive if it requires another vehicle or regular tolls.
- Use transit discounts. Check eligibility for Clipper START and employer transit benefits.
- Review utility assistance. Qualified households may receive PG&E CARE or FERA discounts and ACWD assistance through Help on Tap.
- Join childcare lists early. Compare licensed centers, home-based care, employer benefits, dependent-care FSAs, and schedule flexibility.
- Keep a moving reserve. Deposits, furniture, utility setup, registration, parking, and overlapping leases can create a large first-month bill.
- Recalculate after taxes. A gross salary can look comfortable while take-home income remains tight after federal, state, payroll, retirement, and insurance deductions.
Frequently Asked Questions
What is the average cost of living in Fremont, CA?
There is no official single monthly average for every household. RentCafe’s August 31, 2026 update lists average apartment rent at $2,956. MIT’s Alameda County model estimates basic monthly expenses of about $4,541 after tax for one adult and about $12,367 for two working adults with two children. Replacing MIT’s countywide one-adult housing assumption with Fremont’s current one-bedroom average raises that simple planning total to about $5,023.
How much do you have to make to live in Fremont, CA?
A one-bedroom renter needs about $105,360 in gross annual income to keep RentCafe’s current $2,634 average near 30% of income. MIT’s countywide basic-needs estimate is $67,204 for one adult, while two working adults with two children need about $185,729 combined. Your target should be higher when you have debt, major savings goals, or premium childcare.
Is Fremont an expensive place to live?
Yes. Housing is especially expensive. RentCafe’s August 31, 2026 average apartment rent is $2,956, and Redfin’s July 2026 median home sale price is about $1.50 million. Childcare, transportation, taxes, and utilities can also place significant pressure on a household budget.
What is the average cost of living in California per month?
A statewide average is not very useful because housing and transportation vary greatly between rural counties, inland cities, Los Angeles, Silicon Valley, and the Bay Area. For Fremont planning, use Alameda County household-expense data and current Fremont rent, utility, and transit figures rather than a single California average.
Is $100,000 a year enough to live in Fremont?
It can be enough for one person who finds housing below the current one-bedroom average, has limited debt, and controls transportation costs. RentCafe’s $2,634 one-bedroom average implies about $105,360 in gross annual income under the 30% guideline, so $100,000 can feel tight after taxes, healthcare, retirement contributions, debt, and savings.
How much is rent in Fremont, CA in 2026?
Rent depends on the dataset. RentCafe’s August 31, 2026 apartment-market update reports an average of $2,956 per month, including $2,226 for studios, $2,634 for one-bedrooms, $3,237 for two-bedrooms, and $3,974 for three-bedrooms. Listing-based services can show different medians because they cover different property types and time windows.
Conclusion
Fremont’s cost of living is driven mainly by housing. RentCafe’s August 31, 2026 average apartment rent of $2,956 implies about $118,240 in annual gross income under the 30% guideline, while the average one-bedroom points to about $105,360. Families must also plan for childcare, healthcare, food, and transportation. Under the homebuying assumptions used in this guide, keeping the estimated principal, interest, and base property-tax subtotal near 30% of gross income would require about $359,900 per year before insurance, HOA dues, maintenance, and other debts.
Before moving, compare actual listings, utility responsibilities, commute costs, childcare quotes, insurance, taxes, and take-home pay. A citywide average is a starting point. The best budget is one built around the specific home, household, and commute you expect to have.
Sources
- U.S. Census Bureau QuickFacts: Fremont, California — household income, rent, home value, population, and commute data.
- MIT Living Wage Calculator: Alameda County — household food, childcare, medical, housing, transportation, communications, and required-income estimates.
- RentCafe Fremont Rental Market Trends — August 31, 2026 apartment rents by unit size and neighborhood.
- Redfin Fremont Housing Market — July 2026 median home sale price and market data.
- Bay Area Rapid Transit Fare Information — distance-based fares, discounts, and pass limitations.
- Freddie Mac Mortgage Rates — September 3, 2026 national 30-year fixed mortgage average.
- AC Transit Fares — fares effective July 1, 2026.
- PG&E Base Services Charge — residential electric-bill structure effective March 2026.
- Alameda County Water District Water Rates — 2026 meter, consumption, and average household bill data.
- Republic Services Fremont Rates — trash, recycling, and organics rates for 2026–2027.
- California Department of Tax and Fee Administration — Fremont combined sales-and-use tax rate.
- California Franchise Tax Board 2026 Form 540-ES Instructions — estimated-tax guidance and use of the 2025 tax table.