
Last updated: September 8, 2026
There was no single U.S.-versus-Canada winner on 2026 World Cup hotel prices. Early advertised-rate snapshots showed extreme jumps in selected properties—such as 457% in Houston, 233% in Vancouver, and 2,373% for one Mexico City listing—but those were not final citywide averages. Later performance data showed a more measured pattern: hotels generally gained more from higher room rates than from broad occupancy growth. The most useful comparison is city by city, using the same dates, currency, room type, taxes, and cancellation terms.
Quick Answer
World Cup rooms were generally more expensive on key match dates, but the U.S. was not consistently cheaper than Canada or vice versa. Houston’s realized hotel rate increase was about 21% year over year during its hosting period, while June ADR reached CAD321.27 in Toronto and CAD406.34 in Vancouver. The headline 78%–2,373% increases came from selected pre-event listings, so they should not be treated as national or final market averages.
Key Takeaways
- The often-quoted 457% increase in Houston and 233% increase in Vancouver came from a small December 2025 hotel-listing sample, not final citywide averages.
- The 2,373% Mexico City figure referred to one hotel listing. It did not mean every hotel in the city became 24 times more expensive.
- Actual World Cup performance was largely rate-driven: many hotels charged more without selling substantially more rooms.
- Toronto produced stronger revenue performance than Vancouver, while Vancouver combined higher room rates with a sharp occupancy decline.
- Travelers should compare the total refundable cost for identical dates, currencies, room types, fees, and stay lengths.
| Market | Pre-Event Headline | Realized / Later Result | Best Interpretation |
|---|---|---|---|
| Houston | +457% in a six-hotel advertised-rate snapshot | ADR about +21% year over year; occupancy relatively flat during the hosting period | The early listing spike overstated the realized marketwide rate change. |
| Toronto | +78% in the same advertised-rate snapshot | June ADR CAD321.27 (+19.0%); RevPAR CAD247.18 (+10.4%) | Toronto converted higher rates into stronger overall room revenue. |
| Vancouver | +233% in the same advertised-rate snapshot | June ADR CAD406.34 (+21.3%); occupancy 73.2% (-15.8%) | Rates rose sharply, but a smaller share of available rooms sold. |
| Mexico City | +961% average across six selected listings; one listing +2,373% | No comparable citywide realized ADR figure is used in this article. | Treat the percentage as a listing-snapshot result, not a final citywide average. |
Data note: The pre-event percentages and later ADR results are different metrics from different samples and time periods. Use the table to understand direction and context, not as a like-for-like percentage comparison.
Latest post-event check: An August 17 CoStar U.S. recap found that World Cup hotel revenue gains were driven more by higher room rates than by a broad occupancy surge. An August 7 CoStar Canada analysis found that Toronto significantly outperformed Vancouver in hotel revenue over each city’s full hosting period, despite occupancy declines in both markets.
2026 World Cup Hotel Prices: U.S. vs. Canada

The largest pre-tournament hotel-price figures came from two different types of research. Mixing those studies created many of the contradictions in the original comparison.
A December 2025 report summarized by El País examined six randomly selected Hilton and Marriott properties in each host city. Researchers checked the cheapest available listing in the hotel apps on December 8 and compared it with the price shown three weeks earlier. That snapshot produced increases of 457% in Houston, 364% in Kansas City, 344% in Atlanta, 342% in the San Francisco Bay Area, 233% in Vancouver, and 78% in Toronto.
Those percentages described changes in the remaining advertised inventory at selected hotels. They did not measure the final citywide average daily rate, the amount every guest paid, or a national hotel average.
A separate Lighthouse pricing analysis tracked advertised rates across all 16 host destinations. For group-stage dates, the aggregate market lift was 13.74%, while the mean city-level percentage increase was 14.75%. The same analysis estimated an average game-night listing of $523.59, compared with $398.36 on non-match nights across the full set of host cities.
How to Read Hotel Price Data
| Metric | What It Measures | Why It Matters |
|---|---|---|
| Advertised rate | The price displayed for an available room at a specific moment. | It can change quickly and may reflect only the expensive rooms left for sale. |
| Average daily rate (ADR) | Room revenue divided by the number of occupied rooms. | It is closer to the average rate hotels actually collected. |
| Occupancy | The percentage of available rooms that were sold. | It shows whether higher prices were supported by more room demand. |
| Revenue per available room (RevPAR) | ADR multiplied by occupancy, or room revenue divided by all available rooms. | It shows whether higher rates produced better overall hotel performance. |
Note: A 300% increase in one remaining room listing does not mean a city’s average paid rate rose 300%. High-priced rooms often become more visible after cheaper inventory sells out or is temporarily withheld.
How Much Did U.S. World Cup Hotel Prices Actually Rise?
Houston led the December listing snapshot with a reported 457% increase. Kansas City followed at 364%, Atlanta at 344%, and the San Francisco Bay Area at 342%. These figures showed how aggressively some selected hotels repriced their remaining inventory after the match schedule became clearer.
They did not predict actual occupancy well. In May 2026, the American Hotel & Lodging Association reported that 80% of surveyed respondents across U.S. host markets said bookings were below their initial forecasts. Approximately 70% of respondents in Houston and Dallas said booking pace was below World Cup expectations and broadly similar to a normal June or July.
Post-event data from Houston showed a much smaller realized rate change than the early 457% headline. According to the Houston Chronicle, regional hotel occupancy was relatively flat during the three-week hosting period. Hotels increased their daily rates by about 21% year over year, helping room revenue rise by roughly 20%.
The tournament’s closing weekend produced a stronger result in New York. CoStar reported that New York City reached a record World Cup host-market ADR of $610.48 on the Saturday before the final, with occupancy at 95.7%. However, results were uneven elsewhere: Atlanta’s occupancy fell during semifinal week, and several markets began returning to normal before the tournament ended.
The World Cup’s hotel impact was driven more consistently by higher room rates than by a large increase in the number of rooms sold.
How Did Canada’s World Cup Hotel Prices Compare?
Toronto and Vancouver were often described together, but their actual hotel performance differed. The early 78% Toronto increase and 233% Vancouver increase were advertised-rate snapshots taken months before the tournament. They should not be used as final market results.
Did Canadian Hotel Prices Stay Stable During the World Cup?
Canada did not experience simple price stability. According to CoStar’s June 2026 hotel data, national occupancy fell 3.5% year over year to 73.0%. ADR increased 5.4% to CAD252.63, and RevPAR increased 1.6% to CAD184.33.
Vancouver recorded the largest ADR increase among major Canadian markets, rising 21.3% to CAD406.34. At the same time, occupancy fell 15.8% to 73.2%. This means Vancouver hotels collected more for occupied rooms but sold a smaller share of their available inventory than one year earlier.
Toronto’s ADR increased 19.0% to CAD321.27. Its RevPAR rose 10.4% to CAD247.18, the strongest increase among the major Canadian markets in CoStar’s June report. Toronto therefore converted its World Cup pricing into stronger overall room revenue more effectively than Vancouver.
A later CoStar full-period comparison, published August 7, confirmed the broader pattern. Toronto significantly outperformed Vancouver in hotel revenue from June 11 through the day after each city’s final World Cup match, even though occupancy declined in both markets.
Canada’s national hotel market also strengthened in July. In an August 21 CoStar update, July occupancy reached 78.9% (+1.6% year over year), ADR reached CAD267.44 (+7.2%), and RevPAR reached CAD211.01 (+9.0%). Those are national July figures influenced by events beyond the World Cup, so they provide post-June context rather than a tournament-only measure.
Regional Demand Factors
Several local factors can influence host-city prices:
- Available hotel supply: A city with fewer rooms near the venue can experience faster price compression.
- Match schedule: National teams with large traveling fan bases can create stronger demand than less popular fixtures.
- Normal summer tourism: Cruise traffic, festivals, conventions, and vacation travel compete for the same rooms.
- Business-travel displacement: Companies and conferences may avoid a host city during a major event, reducing non-event demand.
- Alternative lodging: Short-term rentals, suburban hotels, university housing, and nearby cities can reduce pressure on central hotels.
These factors explain why a city can charge more on match nights while reporting lower occupancy over the full month.
Why Did Mexico City Hotel Listings Jump So Sharply?
Mexico City generated the most dramatic pre-event hotel headline, but its numbers need careful context. The widely shared 2,373% increase was not the average increase for the city.
Unprecedented Price Increases
In the December 2025 hotel check, one Le Méridien Mexico City Reforma listing rose from $157 to $3,882 per night after the tournament draw. That equals a 2,373% change for one available room listing at one property.
Across the six selected Mexico City hotels in the same report, the average advertised increase was 961%. Even that figure was based on a small sample and two booking checks three weeks apart. Limited availability in the hotel apps may have left only premium rooms or restrictive rates visible during the second check.
Therefore, it is accurate to say that selected Mexico City listings experienced extreme post-draw repricing. It is not accurate to say that the city’s final average hotel rate increased by 2,373%.
Factors Driving Demand
| Factor | Possible Effect | Important Limitation |
|---|---|---|
| Opening-match demand | More searches for rooms on a narrow set of dates | Search interest does not guarantee completed bookings |
| Thin app inventory | Cheaper rooms disappear, leaving premium listings | Displayed prices may not represent the whole market |
| Dynamic pricing | Hotels test how much travelers will pay | Rates may later fall when booking pace is weak |
| Minimum-stay rules | A short visit appears much more expensive | The nightly rate alone does not show the required total |
Comparisons With Other Cities
The same December sample placed Mexico City well above the U.S. and Canadian host cities. Mexico City averaged a 961% advertised increase across its six selected properties, compared with a reported U.S. range of 174% to 457% and a Canadian range of 78% to 233%.
These figures are useful for showing how quickly selected listings changed immediately after the draw. They are not suitable for ranking final hotel affordability because they do not account for completed bookings, later price cuts, taxes, exchange rates, hotel class, or the amount of inventory available in each city.
Key Factors Inflating U.S. Hotel Prices During the World Cup
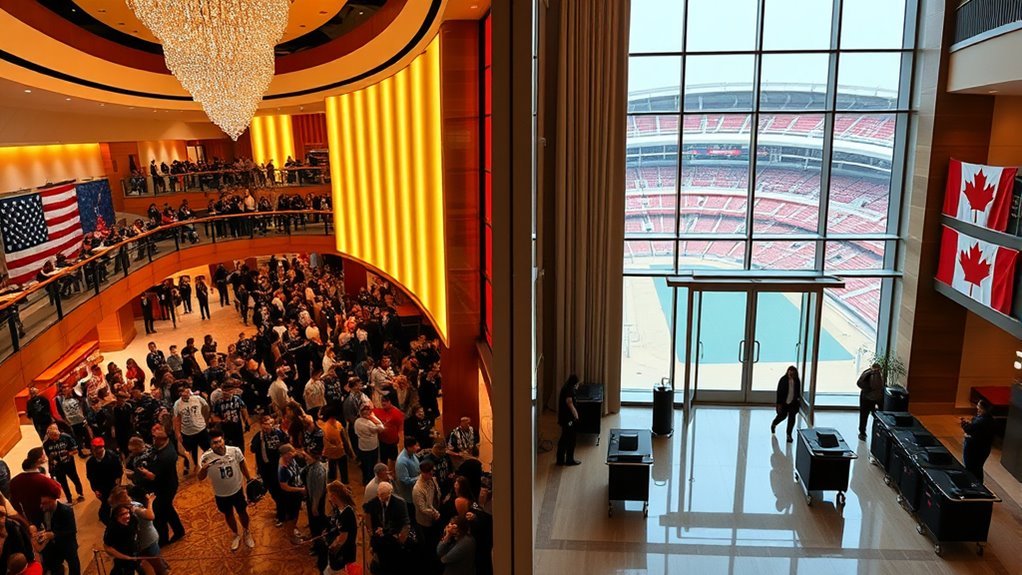
Several factors pushed U.S. room rates higher, even where occupancy failed to increase:
- Short match-night demand windows: Demand concentrated on the night before and the night of a game.
- Team and fixture popularity: High-profile teams attracted more traveling supporters.
- Room blocks and restricted inventory: FIFA room blocks created an artificial early demand signal in some U.S. host markets; AHLA later reported material room-block releases among roughly half of surveyed host-market respondents.
- Rate anchoring: Hotels initially posted high prices to avoid selling too cheaply before demand became clear.
- Overlapping events: Conventions, festivals, and holiday travel added pressure in some cities.
- Business displacement: Regular group and corporate travelers sometimes moved their trips, weakening occupancy outside key match nights.
The final factor is important. A hotel can raise its ADR while losing occupancy if event visitors replace regular travelers rather than adding enough new room nights to fill the market.
Warning: A displayed hotel rate may exclude lodging taxes, destination charges, parking, breakfast, currency-conversion costs, or a multi-night minimum. Compare the final checkout total and cancellation terms, not only the first nightly price shown.
Why Canadian Hotel Prices Were Not Always Lower
Canadian hotels were not automatically cheaper than U.S. hotels. Vancouver was one of the most expensive host destinations in several pre-event advertised-rate datasets, while Houston appeared among the lower-cost markets in later Lighthouse tracking.
The original comparison also mixed U.S. dollars, Canadian market data, one-night prices, two-night totals, and different research dates. A valid comparison must use:
- the same check-in and checkout dates;
- the same room type and occupancy;
- the same currency;
- the same treatment of taxes and mandatory fees;
- similar hotel quality and distance from the venue; and
- the same refund and minimum-stay terms.
Using realized June data, Vancouver had a higher ADR than Toronto but also a much larger occupancy decline. This shows why “more expensive” and “stronger hotel market” are not the same conclusion.
How Much More Did Hotels Cost on World Cup Match Nights?
Game nights usually created the sharpest pricing pressure, but the size of the premium differed by city, fixture, hotel class, and booking date.
Game-Day Price Differences
Lighthouse’s pre-event analysis estimated an average advertised rate of $523.59 on game nights across the 16 host destinations, compared with $398.36 on non-match nights. That represented a 31.44% game-night premium across the entire dataset.
This was not an average of $523.59 for U.S. hotels versus $398.36 for Canadian hotels. Both figures combined cities in the United States, Canada, and Mexico.
Vancouver produced some of the highest advertised game-night prices in the Lighthouse study, including a projected peak average of $1,455. Houston and Atlanta appeared more stable in that particular dataset. Those findings differed from the separate December six-hotel snapshot because the studies used different properties, time windows, and methods.
Regional Price Variability
Final performance remained highly local. New York reached its strongest rate and occupancy immediately before the final. Houston raised rates but kept occupancy relatively flat. Toronto increased both ADR and RevPAR, while Vancouver’s ADR increased as occupancy fell.
For travelers, this means a country-level comparison is less useful than comparing the exact city and match date. A group-stage match in a large hotel market may cost less than a semifinal or final in a supply-constrained market, even when both are in the same country.
Booking Strategies Comparison
Travelers can reduce risk by following a simple booking process:
- Reserve a refundable room early. This creates a price ceiling without locking you into an inflated nonrefundable rate.
- Continue checking the same dates. Early event rates can fall when hotels release room blocks or booking demand disappoints.
- Compare the complete stay. Include taxes, required nights, parking, transportation, and currency conversion.
- Search along reliable transit routes. A hotel outside the venue district may be cheaper without creating a difficult trip.
- Check loyalty points. Award prices do not always rise at the same speed as cash rates.
- Avoid separate one-night bookings. Moving hotels can add baggage-storage and transportation costs.
- Reconfirm before the free-cancellation deadline. Compare the latest rate before deciding which reservation to keep.
Pro Tip: Save screenshots of the room description, taxes, refund deadline, and included benefits. If the hotel later changes a material term, you will have a clear record of what was offered when you booked.
Long-Term Impacts on Hotel Pricing After the World Cup
It is too early to conclude that the World Cup permanently raised hotel prices across North America. The event clearly demonstrated that hotels can exercise strong pricing power during short, high-demand windows. It also showed that aggressive pricing can displace normal travelers and weaken occupancy.
During the final full tournament week, the four U.S. markets hosting matches recorded a combined 29% ADR increase. However, several cities that had completed their schedules were already returning toward normal performance. Atlanta also sold fewer room nights during semifinal week than during the comparable week one year earlier because group demand declined.
The more defensible long-term lesson is that future mega-events will produce uneven results. Cities with constrained supply, strong fixtures, useful transit, attractive leisure demand, and limited competing inventory may sustain higher rates. Cities with deep hotel supply or weak booking pickup may need to reduce early prices.
Note: A temporary record rate does not become a permanent benchmark automatically. Long-term conclusions require several months of ADR, occupancy, RevPAR, new-supply, and visitor-demand data.
Strategies for Navigating Hotel Price Increases During Major Events
The World Cup has ended, but its pricing lessons apply to future sporting events, concerts, conventions, and festivals.
| First Search | Check the venue district, transit-connected neighborhoods, airport hotels, and nearby cities. |
| Best Rate Type | A refundable reservation with a clear cancellation deadline. |
| Comparison Method | Compare the total stay in one currency, including taxes, mandatory fees, parking, and required nights. |
| Price Monitoring | Recheck after schedules, team assignments, room-block releases, and cancellation deadlines. |
| Main Risk | Locking in a high nonrefundable rate based on an early demand forecast. |
Booking early still has value, but “early” should not mean accepting any price. A flexible reservation lets you benefit if rates rise while preserving the option to rebook if the market corrects.
Frequently Asked Questions
Were hotels more expensive in Canada during the 2026 World Cup?
Some Canadian hotel stays were more expensive, especially in Vancouver, but Canada was not uniformly pricier than the United States. Vancouver’s June ADR reached CAD406.34, while Toronto’s was CAD321.27. CoStar’s later full-period comparison found Toronto outperformed Vancouver in hotel revenue despite occupancy declines in both cities. The final cost still depended on the city, match date, hotel class, location, currency, and booking terms.
Did U.S. hotel prices drop before or during the World Cup?
Some early advertised rates corrected as booking demand became clearer, while high-demand match nights remained expensive. Actual results varied by market. Houston’s ADR rose about 21% during its hosting period, while New York reached a record $610.48 ADR on the Saturday before the final.
What was the average hotel rate in Canada?
CoStar reported a nationwide Canadian ADR of CAD252.63 for June 2026 and CAD267.44 for July 2026. Those figures are average room revenue per occupied room across Canada, not consumer quotes or Canada-only World Cup rates. Vancouver and Toronto were substantially above the June national figure during the tournament period.
What was the average U.S. hotel price during the World Cup?
There was no single useful national World Cup price. The original $1,013 claim came from a limited sample of selected host-city listings and was not a U.S. national ADR. Prices differed greatly by host city, match, hotel class, and booking date.
What did Houston’s reported 457% hotel-price increase mean?
It described the average change in the cheapest available listing at six selected Hilton and Marriott properties checked three weeks apart in late 2025. It did not mean Houston’s final citywide ADR rose 457%. Local post-event reporting placed the realized ADR increase near 21%.
When should I book a hotel for a future major event?
Book a refundable option once your dates are reasonably firm, then monitor the same stay. Recheck after schedules are announced, room blocks are released, and free-cancellation deadlines approach. Compare the total cost before replacing the original reservation.
Conclusion
The 2026 World Cup raised hotel rates, but it did not produce one simple U.S.-versus-Canada result. Early listing snapshots overstated what later citywide performance data showed in several markets. The more consistent pattern was higher ADR, uneven occupancy, sharp match-night peaks, and weaker demand on some surrounding dates.
For travelers planning future mega-events, the best defense against event pricing is a refundable reservation, consistent like-for-like total-cost comparisons, and repeated rate checks as room blocks are released. For a U.S.-only seasonal benchmark outside these host-city event spikes, see our average U.S. hotel cost during summer 2026.
Sources
- El País: Mexico City hotel prices before the World Cup — methodology and selected-property advertised-rate increases.
- Lighthouse World Cup hotel-price analysis — aggregate and city-level post-draw advertised pricing, plus game-night premiums.
- American Hotel & Lodging Association World Cup outlook — U.S. host-market booking expectations and room-block releases.
- CoStar June 2026 Canada hotel performance — Canadian, Toronto, and Vancouver ADR, occupancy, and RevPAR data.
- CoStar final World Cup host-market report — final-week U.S. hotel rates, occupancy, and market normalization.
- Houston Chronicle post-event analysis — Houston occupancy, ADR, hotel revenue, and visitor results.
- CoStar U.S. World Cup recap — full-tournament U.S. context on rate-driven revenue gains and uneven occupancy.
- CoStar Toronto vs. Vancouver World Cup analysis — full hosting-period revenue and occupancy comparison.
- CoStar July 2026 Canada hotel performance — post-June national occupancy, ADR, and RevPAR context.