

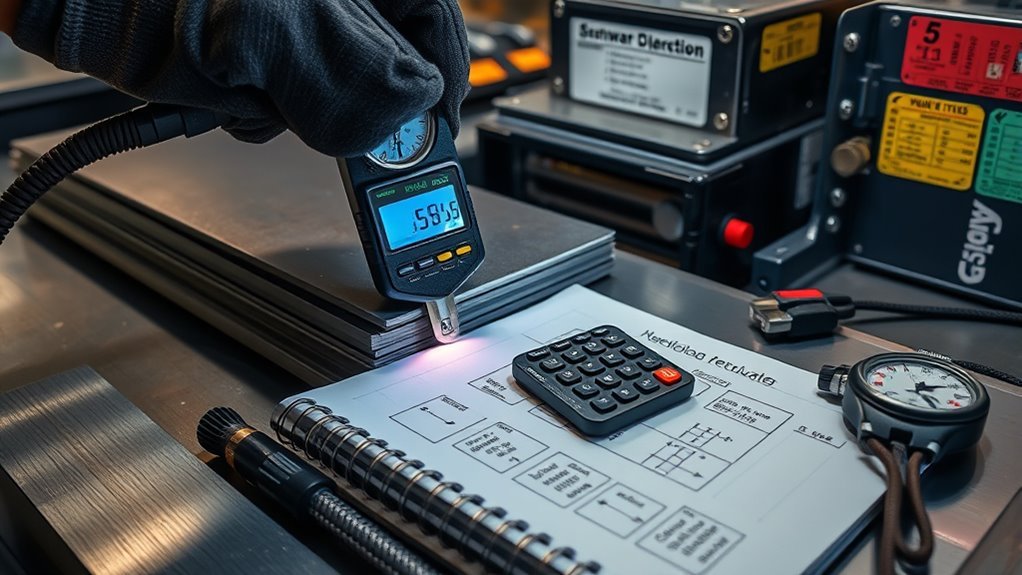
To calculate spot-welding cost, log material weights and unit prices, then measure consumable use (wire, electrodes) per run. Record ARC on/off time to get kWh consumed. Multiply cycle time by the hourly wage for labor, then spread machine depreciation and maintenance across operating hours. Add overhead, gas, and utilities, sum everything to get cost-per-weld, then multiply by welds-per-part for your final cost-per-part.
Quick Answer
- Track material costs: log wire weight, flux ratios, and unit prices per run.
- Calculate energy: use Q = I²Rt to find joules, then convert to kWh.
- Add labor: multiply cycle time (including setup and downtime) by the hourly wage.
- Include equipment: add straight-line depreciation plus 5–10% annual maintenance.
- Sum all line items, divide by total welds for cost-per-weld, then multiply by welds-per-part.
- Verify inputs against machine logs and purchase orders before finalizing the report.
Understanding Resistance Spot Welding Basics
Resistance spot welding joins overlapping metal sheets by clamping them with electrodes and forcing a high electric current through the contact area. That current generates heat from electrical resistance and forms a weld nugget.
You apply controlled pressure and current for a set time. Those three parameters — pressure, current, and time — determine nugget size and joint strength.
Non-consumable electrodes (copper or tungsten) maintain contact shape and conductivity throughout the process.
The method suits low thermal conductivity metals like low-carbon steel and pairs well with processes that prioritize repeatability.
In automated lines, you get consistent cycle times, minimized heat-affected zones, and reduced warping, all of which lower rework costs.
For cost calculation, quantify cycle time, electrode life, energy per weld, and automation benefits to build a reliable unit cost model.
Identifying Materials and Thicknesses
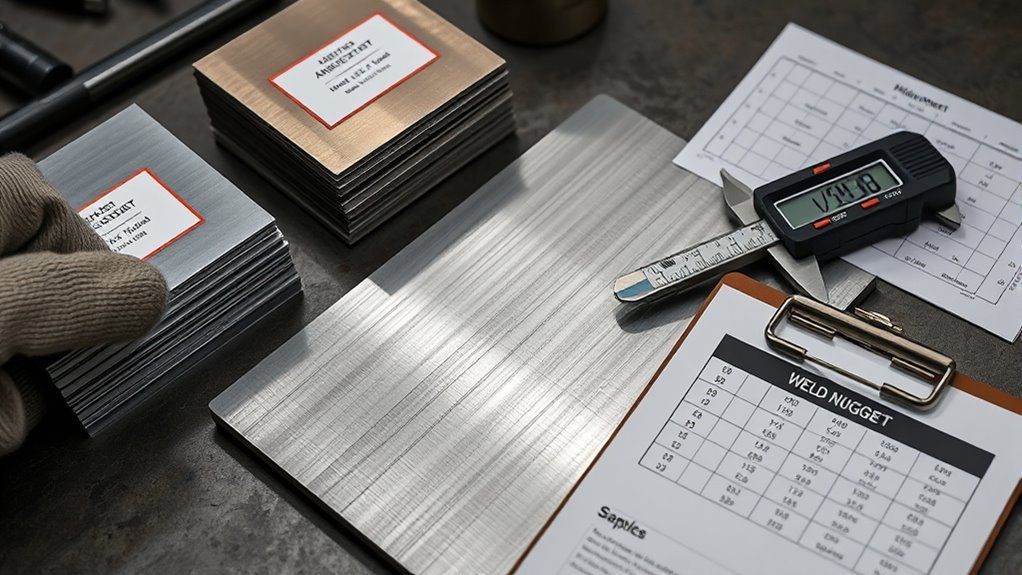
Start by listing the base metals (low-carbon steel, stainless, aluminum, galvanized). Their resistivity and thermal conductivity affect welding current and cycle time, so knowing them upfront shapes the whole cost estimate.
Record sheet thickness ranges. Spot welding is most effective under about 3 mm. Thicker stacks or thin foils change electrode force and weld time.
Also note coatings and platings (galvanize, paint, zinc) since they may require adjusted parameters or pre-treatment, both of which add process cost.
Base Metal Types
For spot welding, focus on low-carbon steel, stainless, and galvanized steel. Their low thermal conductivity and higher electrical resistance concentrate heat at the joint and produce reliable welds. Prioritize material compatibility and welding efficiency when estimating cost.
Avoid difficult alloys with high melting points unless you’ve confirmed they work with your available equipment. Check electrical resistivity values — they set the required current and dwell time, which drive energy and electrode wear costs.
Align sheets precisely to prevent warping and rework, which inflate both labor and scrap expenses. Spot welding is optimized for thinner gauges. If metals exceed practical limits, expect parameter changes or alternative joining methods, and both raise per-joint cost while reducing throughput.
Sheet Thickness Ranges
Spot welding works best on thinner gauges. For low-carbon steel, expect reliable results primarily between about 0.5 mm and 3 mm. Outside that window, you’ll need altered parameters or a different joining method.
Treat those thickness ranges as the baseline for cost and process planning. If material thickness exceeds roughly 3 mm, spot welding often causes excessive heat and deformation, so consider alternatives.
For stainless steel, aluminum, or high-strength grades, adjust energy, force, and timing. Electrical resistance and thermal conductivity change heat input and nugget formation for each of those materials.
High-strength steels demand tighter parameter control to protect their mechanical properties.
When estimating cost, map material type to thickness range, then factor in additional setup time, cycle time, and potential rework for nonstandard gauges.
Coating and Plating
Coatings like zinc, aluminum, and galvanic layers change electrical resistance and heat flow. Identify the coating type and measure its thickness before quoting or setting parameters.
Inspect the material, record coating thickness, and confirm it falls within the effective welding range (typically 5–25 μm for zinc, 10–40 μm for aluminum).
Adjust welding parameters when coatings alter conductivity or act as contaminants. Clean surfaces to remove residues that raise contact resistance.
- Measure coating thickness with a gauge; log material and μm value.
- Verify coating is no more than 25% of base metal thickness for reliable welds.
- Increase current/time or modify electrode force when coatings raise resistance.
- Reclean and retest if coatings cause inconsistent nugget formation.
Determining Electrode Type and Geometry
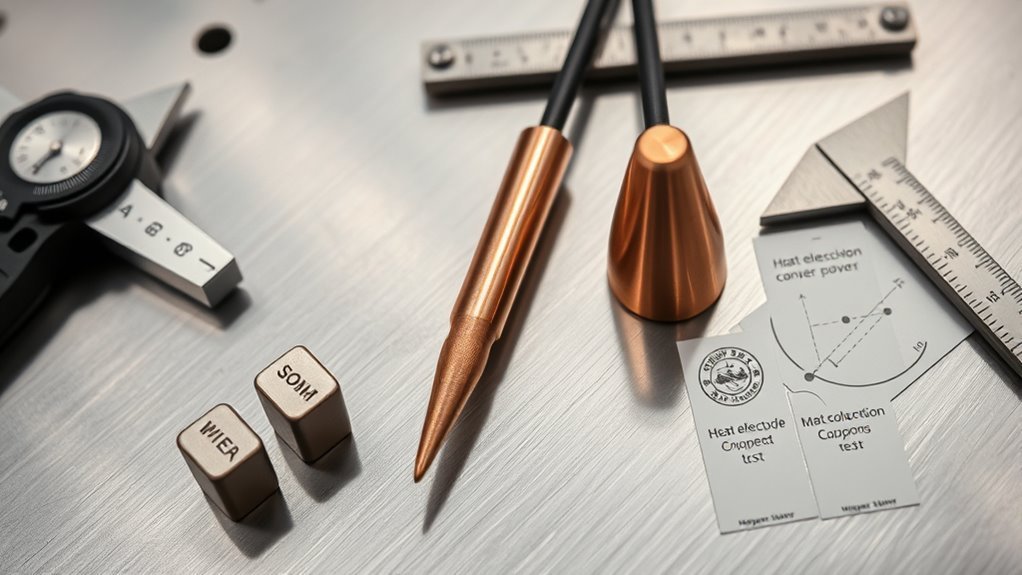
Choose electrode materials based on the alloys you’re joining. Use copper or copper alloys for resistive steels and molybdenum or tungsten for highly conductive metals like copper or gold.
Select tip shape and diameter to match nugget size and penetration needs. Pointed tips concentrate heat for small welds; dome tips spread it for broader, larger nuggets. Larger diameters increase weld width but can reduce depth.
Monitor wear and schedule reshaping to maintain squeeze pressure and consistent weld quality. Improper electrode selection speeds up degradation and raises cost through rework.
Products Worth Considering

LIGHTWEIGHT HANDLING: Compact, ergonomic holder weighs just 1.5 lb for reduced fatigue in tight spaces.
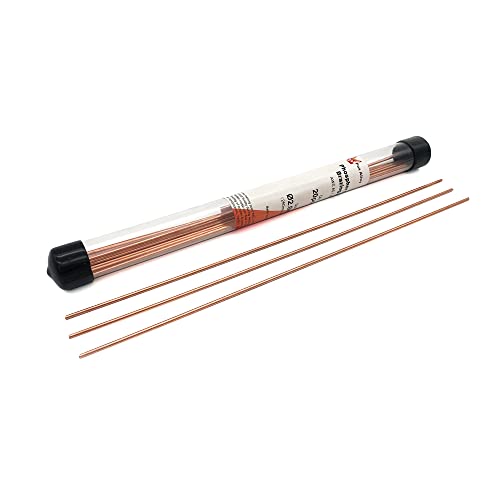
Material: The package includes 20PCS 2.0mm cooper brazing rods BCuP-2 brass brazing rod

【Ergonomic Grip Reduces Fatigue】 Experience reduced hand strain with the HM400A's ergonomically designed handle, cutting fatigue by 50% during extended welding projects. Its comfortable, non-slip grip ensures consistent control and comfort, allowing you to work longer with less effort.
Electrode Material Selection
Electrode selection blends material and geometry to control heat, contact resistance, and wear. For guidance, Lincoln Electric’s welding resources provide practical references for matching electrode type to application. In general, pick copper alloys for conductive steels and aluminum, and consider molybdenum or tungsten for high-resistance or high-temperature metals.
Balance conductivity, mechanical strength, and cost to minimize electrode wear and maintain consistent nuggets. Inspect and record tip condition regularly — maintenance frequency ties directly to material choice.
- Choose copper alloys for high-conductivity applications to reduce I²R losses and limit electrode wear.
- Use molybdenum or tungsten for resistive or hot joints where copper deforms or alloys contaminate welds.
- Match electrode diameter to sheet thickness to control heat flow and avoid excessive deformation.
- Track service life and replacement cost per weld to quantify the impact of material selection on total welding cost.
Tip Shape and Size
Once you’ve settled on material, tip shape and size determine how heat and force distribute into the parts. They control nugget diameter, penetration, and deformation.
Pick tip geometry (pointed, truncated, or dome-shaped) based on sheet thickness and joint objectives. Pointed tips focus heat locally; truncated tips provide broad contact; dome tips balance distribution across the joint.
Key selection criteria include conductivity (copper and alloys for resistive metals), tip diameter relative to material thickness, and allowable deformation. Aim to limit tip area so deformation stays below roughly 25% of effective sheet thickness.
Monitor alignment and wear — misalignment raises variability and adds cost. Use regular inspection and replacement schedules to keep tip geometry consistent and protect weld quality and cycle efficiency.
Measuring Wire and Consumable Usage
Record total wire usage per product in kilograms and track wire-to-flux ratios (typically 0.5–2.5) so you can convert material consumption into precise unit costs.
Focus on wire efficiency and consumable optimization by measuring mass, counts, and replacement intervals. Log cycle time and ARC on/off events per product to link consumable wear to specific process steps. Use these measurements to calculate per-unit consumable cost and identify waste.
- Weigh wire spools before and after runs; record kilograms used.
- Measure flux consumed and compute the wire-to-flux ratio for each product.
- Track cycle time and ARC on/off to connect usage to process steps.
- Record tip and consumable life plus replacement cost per unit.
These metrics give actionable, data-driven cost inputs you can use directly in your cost model.
Products Worth Considering

6 IN 1 MULTI PROCESS: Flaring 215A MIG welder features multiple welding modes including Gas MIG/Flux Core MIG/Stick/Lift TIG/Spot welding/Spool gun (TIG torch and spool gun not included), allowing you to easily switch between modes using the panel buttons to meet your welding needs in various scenarios and is compatible with both 2lb and 11lb welding wire

POWERFUL 6-IN-1 MIG WELDER: The multi-process welding machine that included Gas/Solid Wire MIG(GMAW), Gasless Flux Core MIG(FCAW), Stick/MMA, Spot welding, Lift TIG, spool gun connector optional (tig gun and spool gun not included). Suitable for all kinds of welding requirements .023”/.030”/.035” solid wire, .030”/.035” flux core wire, .035”/.040” aluminum wire. (.023”, .040” rollers need to buy separately)

6 in 1 Welding Machine: The multi-function welding machine included Gas/Solid Wire MIG, Gasless Flux Core MIG, Stick/MMA, Spot welding, Lift TIG, spool gun compatible (tig gun and spool gun not included,WP-17V-35,LBT150).
Calculating Energy Consumption and ARC Time
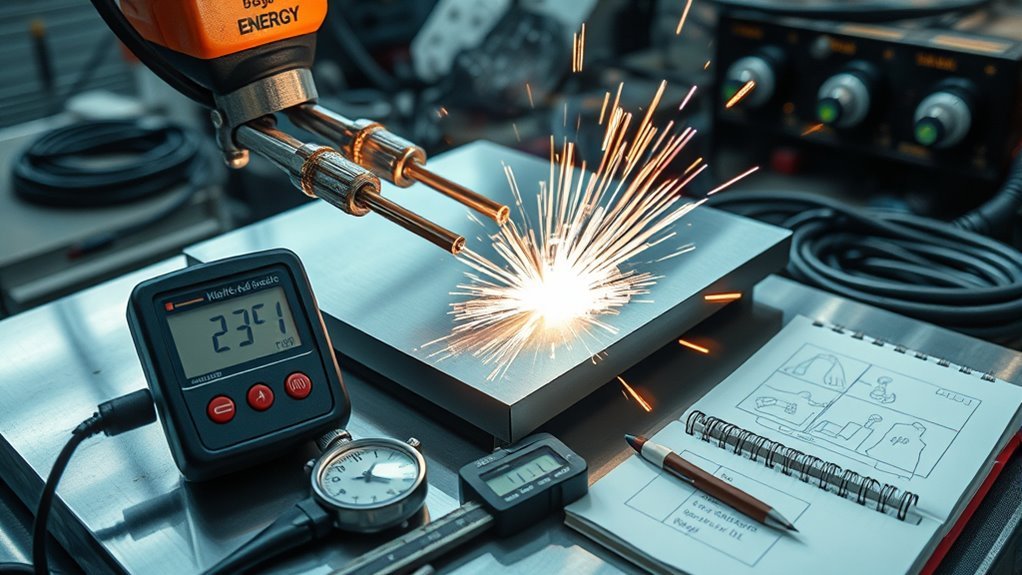
While you log wire and consumable use, also measure ARC on-time and total energy per product. This lets you convert welding activity directly into kWh and cost.
Track ARC start and stop for every cycle, record welding current and resistance where possible, and calculate heat energy with Q = I²Rt. To convert joules to kWh, divide by 3.6 × 10⁶. That gives you precise per-part energy consumption for budgeting and efficiency analysis.
Timestamp ARC on/off for each weld, sum the seconds per part, and convert Q to kWh. Use logged current (I) and resistance (R) values or instrumented averages when spot-to-spot conditions vary.
Analyze results to find energy efficiency improvements. Target cycle optimization by shortening unnecessary ARC time, adjusting current to minimize I²R losses, and validating savings against measured kWh per unit.
Products Worth Considering

Professional Ggs Flow Tester / Meter Peashooter Style

Multi-function power monitor: Our electric usage monitor can monitor the power (W), electricity(kWh), voltage(V), frequency(Hz), current(A), power factor(PF), unit price($/kWh), total cost($) of your appliances. By switching 8 display modes, you can easily know the various parameters while the appliance is working. The “electricity” mode can calculate and display how much power your appliance uses. And the “total cost” mode will show how much electricity bill it cost in cumulative time

【8000mAh Rechargeable Battery】Experience unrestricted cordless operation for on-the-go or on-site use — charge the battery to full capacity (100%) prior to initial use to unlock peak performance
Estimating Labor and Cycle Time Costs
The clearest way to estimate labor costs for spot welding is to multiply the welder’s hourly wage by total hours on the job. Include setup, welding, inspection, and unavoidable downtime.
At the same time, track actual cycle times (squeeze, weld, hold, and off) to calculate welds per hour. This lets you convert productivity into a labor cost per weld and identify which cycle-phase reductions will reduce cost most.
Use real measured times, not estimates, and always include downtime. Once you have welds-per-hour, multiplying by the hourly wage gives a solid cost-per-weld figure you can defend.
- Measure actual cycle times and downtime.
- Calculate welds per hour.
- Multiply by hourly wage for cost per weld.
- Identify the highest-impact cycle-time reductions.
Products Worth Considering
✓ EASY TO USE: Our timer provides the simplest way to repeat a task. Use on your humidifiers, ventilation fans, pumps, heaters, sprinklers, aquaponics, aeroponics, hydroponics, and more

Customizable Continuous Intervals: the on and the off repetitive intervals can be as short as 1s, and as long as 999 hours (about 41.5days), more flexible for your different needs.Please note: this timer doesn't allow programming based on actual time.
![Digital Infinite Repeat Cycle Timer Plug with Countdown and 24 Hour Daily on-Off Programs for Electrical Outlets, Lights, Hydroponic Pumps (120V, 15A) [2 Pack]](https://m.media-amazon.com/images/I/41k3PBEuy7L._SL500_.jpg)
3-in-1 Design: with 3 daily repeatable on-off timers, a short on-off cycle repeat timer with several working modes, and a delay (countdown) on/off timer, this timer is more versatile and practical
Accounting for Equipment Depreciation and Maintenance
Quantify equipment depreciation using a defined method (straight-line or declining balance) based on the machine’s initial cost and expected lifespan.
Add scheduled maintenance costs — routine inspections, parts replacements, and specialized service — as an annual or hourly figure tied to tracked operating hours.
Combining depreciation and maintenance gives the true hourly ownership cost to include in your spot-welding price model.
Products Worth Considering

Ergonomic handle design, one-handed operation, convenient to use. Have multiple cooling holes to cool the temperature when using the pen.

Wide Applications - From metal manufacturing to automotive making, electronics assembly to metal fabrication, this metal sheet spot welding machine is your go-to solution for efficient spot welding. Our metal sheet spot welding machine is your go-to solution for efficient spot welding.

Weld Like a Pro: Designed for steel sheets up to 1/8" thick (such as carbon steel), this portable spot welder delivers strong, reliable welds for various fabrication tasks. (Not suitable for aluminum & stainless steel)
Depreciation Calculation Methods
Because equipment costs directly affect per-weld pricing, pick a depreciation method that matches your cash-flow and tax goals while reflecting actual usage.
- Straight-line: Divide initial cost by useful life for equal annual expense. Simple and produces stable forecasts.
- Declining balance: Accelerates write-offs early, improving tax relief and cash flow in the first years.
- Units of production: Ties expense to actual welding hours or cycles, matching cost with output.
- Hybrid/adjusted: Combine methods or switch when usage patterns change to keep forecasts accurate.
Choose the method that best fits your tax strategy, reporting needs, and production profile.
Scheduled Maintenance Costs
Scheduled maintenance for spot-welding equipment typically runs 5–10% of the initial purchase price per year. Account for that alongside depreciation to get an accurate annual equipment cost.
First, calculate annual depreciation: initial cost divided by useful life. Add scheduled maintenance (5–10% of initial cost) to get a baseline annual equipment expense.
Track maintenance records to refine estimates over time. Frequency and repair types let you adjust the maintenance percentage and forecast budgets with more confidence. Include these combined annual equipment costs in per-part or per-hour welding rates.
Routine servicing also prevents emergency repairs, which typically cost far more than planned maintenance and hurt cost predictability.
Adding Overhead, Gas, and Utility Expenses
Include overhead, gas, and utility expenses as discrete line items so you can see their direct impact on project margins.
Use overhead allocation as a percentage of total welding costs. Apply gas estimation using price per cubic meter or liter times projected consumption. Track utility costs by multiplying kWh used by your local electricity rate.
Track the frequency and duration of welding sessions to distribute these charges accurately. This data-driven approach makes pricing and budget refinement much easier.
- Allocate overhead (%) across projects based on hours or output.
- Estimate gas needs from process flow and unit pricing.
- Track welding session time to apportion electricity costs.
- Combine figures into a clear line-item summary for review.
Computing Cost per Weld and Cost per Part
With overhead, gas, and utility expenses broken into line items, calculate cost per weld by summing material (including wire and flux ratios), labor, equipment depreciation, and allocated overhead.
Divide that total by the number of welds performed. Include energy consumption converted from kWh to currency and adjust material quantities for throat or leg sizes to reflect true wire-per-kg usage.
Divide total costs by weld count, include energy (kWh converted to currency), and adjust material for true wire/kg usage.
Quantify wire consumption per product in kg and multiply by wire unit cost, applying the wire-to-flux ratio to capture flux expense. Add converted energy cost and per-weld labor and depreciation. Divide the total by weld count for cost per weld.
Get cost per part by multiplying cost per weld by the welds required per assembly. Use this figure for precise cost analysis and budget planning.
Verifying Results and Generating a Cost Report
Before finalizing numbers, verify every input — wire consumption, labor rates, energy kWh, and allocated overhead — so your totals match source documents and machine logs.
Perform cost verification by reconciling each line item. Use software or online calculators to cross-check computations and flag inconsistencies.
Generate a structured cost report that compiles material, labor, energy, and overhead with unit rates and totals. Export to PDF and embed a QR code linking to raw analysis files for traceability.
- Reconcile inputs to purchase orders, timesheets, and machine logs.
- Run automated cross-checks in your calculator or ERP tool.
- Compare totals to historical projects to spot anomalies.
- Save and distribute the PDF report with QR-linked source data.
Frequently Asked Questions
How Do Warranty Costs Affect Spot Welding Pricing?
Warranty costs raise spot-welding pricing because you must factor warranty duration into the cost analysis. Allocate expected repair and replacement expenses, adjust margins to cover claim probability, and update pricing models based on historical failure rates and warranty terms.
Can Alloy Recycling Credits Reduce Overall Welding Costs?
Yes. Recycled alloys can reclaim up to 30% of material value, so recycling programs produce measurable cost savings. You’ll cut raw-material spend, offset processing fees, and improve overall welding margins with proper tracking.
What Insurance Requirements Influence Spot Welding Project Bids?
You need liability coverage limits and proof of insurance. Use risk assessment data to set policy types, deductibles, and premiums. Workers’ compensation, general liability, and equipment insurance all affect bid pricing and contingency allowances directly.
How Should Training Certification Costs Be Allocated per Weld?
Amortize training and certification costs per weld by dividing total trainer fees, training expenses, and certification-adjusted wages by projected welds over the certification lifespan. Update quarterly using actual throughput, pass rates, and retraining frequency.
Do Environmental Disposal Fees Apply to Used Electrodes?
Yes, disposal fees often apply. Track electrode disposal, comply with environmental regulations, document hazardous waste handling, and budget per-weld disposal costs based on volume, contamination level, and local fee structures.
Conclusion
Spot-welding cost breaks down into measurable parts: materials, electrodes, energy, machine wear, and overhead. Once you’ve quantified each piece, calculating per-weld and per-part cost is straightforward. Each input shifts the final number, so measure carefully, document your assumptions, and run sensitivity checks. Use actual shop data, update rates regularly, and produce a clear cost report to guide quoting, process improvement, and purchasing decisions.
